
USDCAD approaches important level of 1.3460
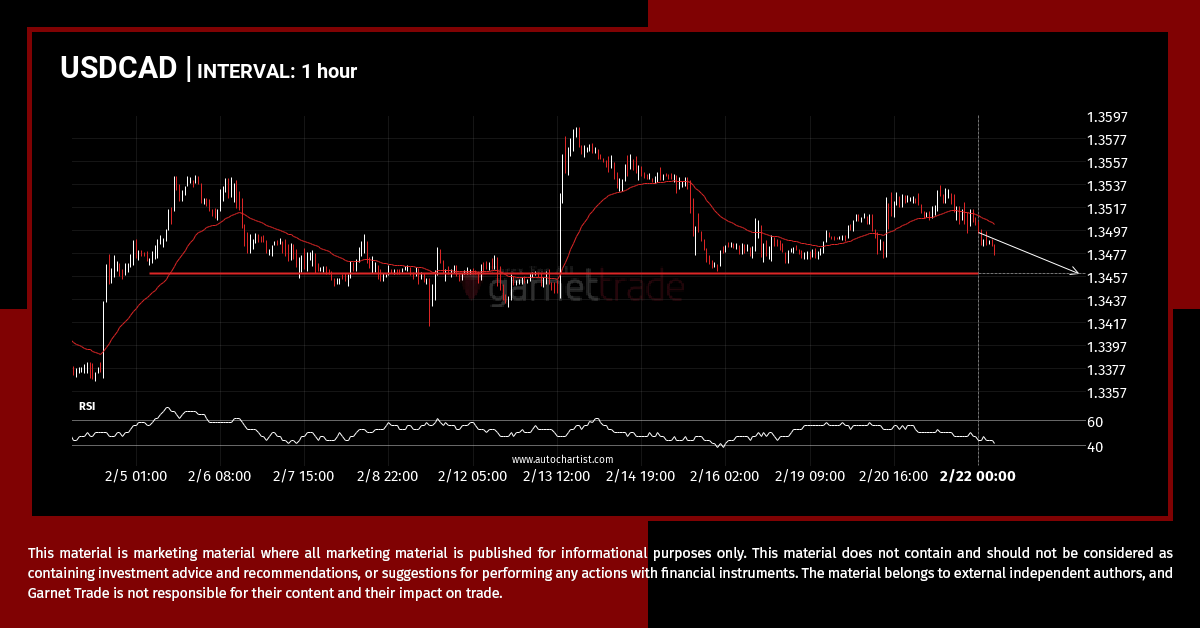
A strong support level has been identified at 1.3460 on the 1 hour USDCAD chart. USDCAD is likely to test it soon.
AUDUSD approaches important level of 0.6517
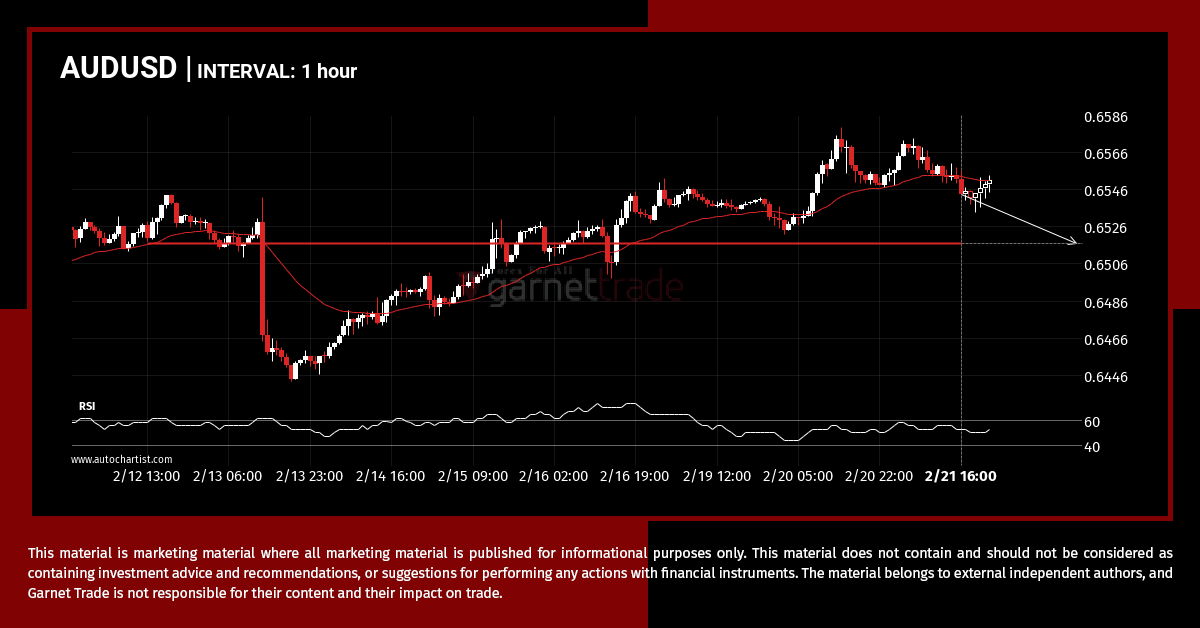
AUDUSD is moving towards a support line. Because we have seen it retrace from this level in the past, we could see either a break through this line, or a rebound back to current levels. It has touched this line numerous times in the last 10 days and may test it again within the next […]
Should we expect a breakout or a rebound on EURGBP?
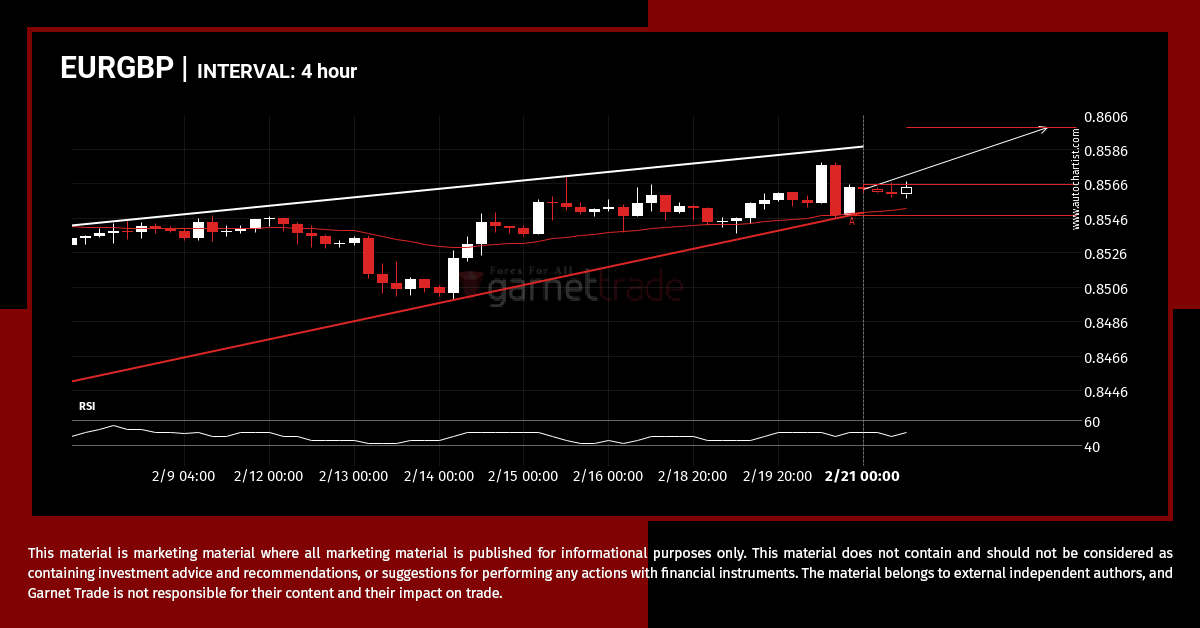
EURGBP is moving towards a resistance line. Because we have seen it retrace from this line before, we could see either a break through this line, or a rebound back to current levels. It has touched this line numerous times in the last 14 days and may test it again within the next 3 days.
Possible start of a bullish trend on EURUSD
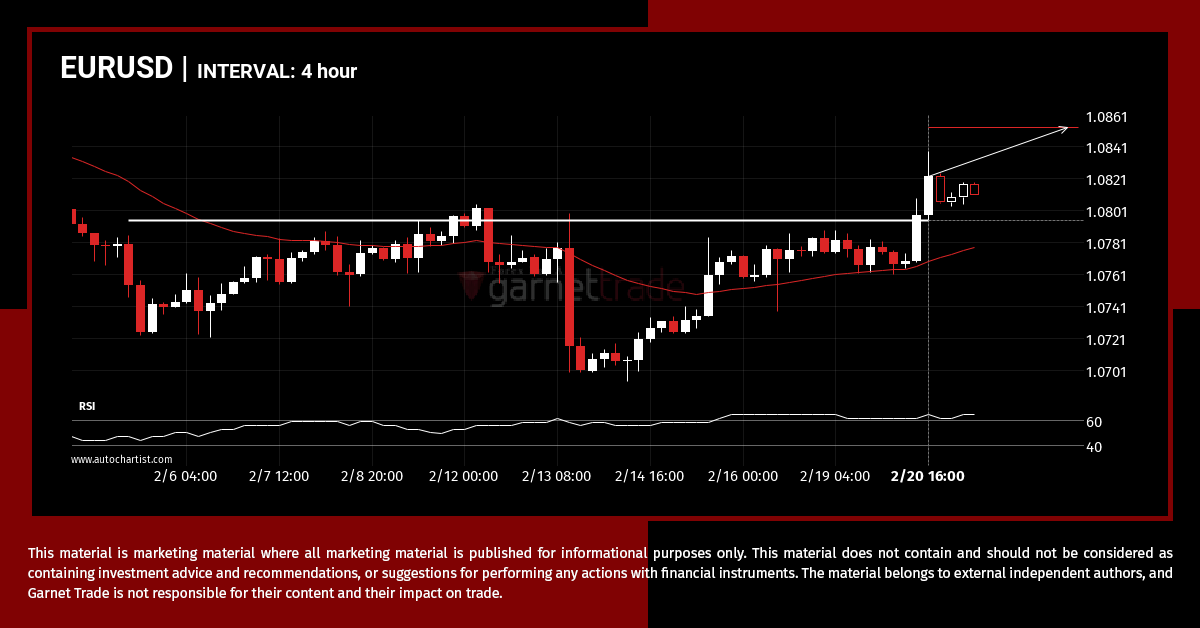
EURUSD has broken through 1.0795 which it has tested numerous times in the past. We have seen it retrace from this price in the past. If this new trend persists, EURUSD may be heading towards 1.0854 within the next 3 days.
XAUUSD – support line breached
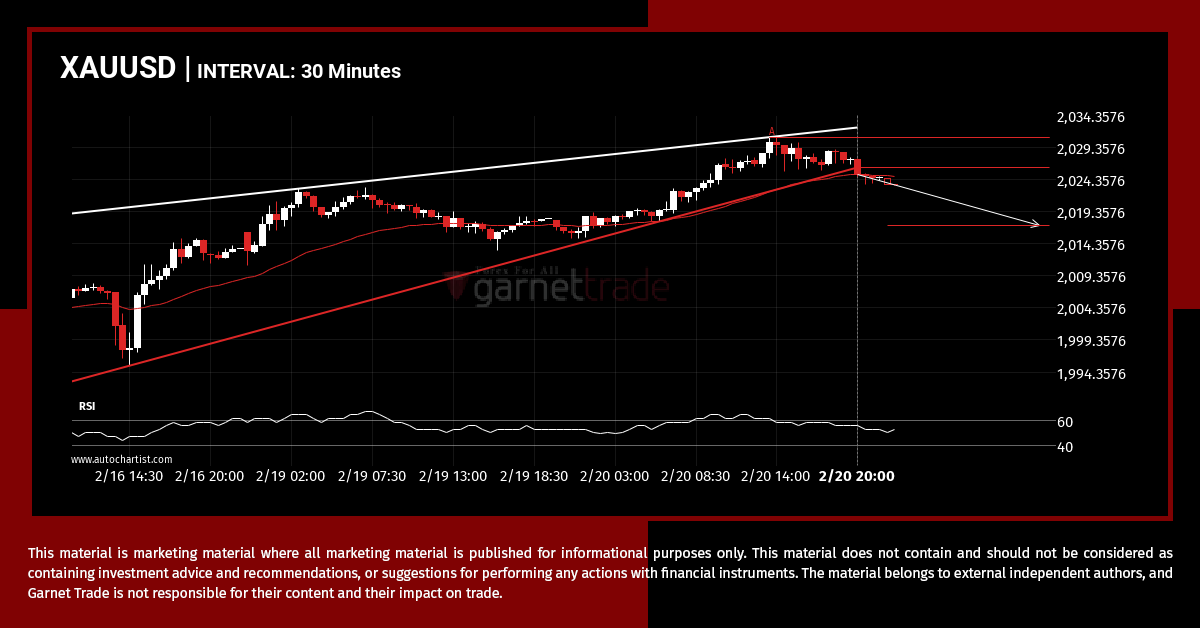
XAUUSD moved through the support line of a Rising Wedge at 2026.2237499999999 on the 30 Minutes chart. This line has been tested a number of times in the past and this breakout could mean an upcoming change from the current trend. It may continue in its current direction toward 2017.1116.
USDCAD is on the approach
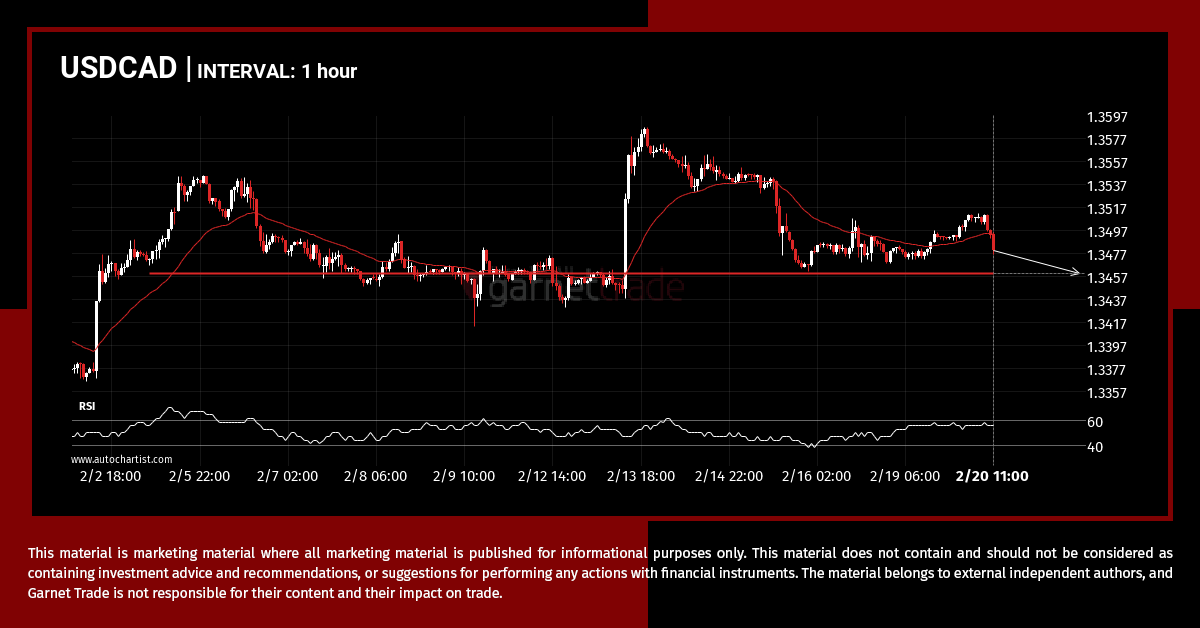
The movement of USDCAD towards 1.3460 price line is yet another test of the line it reached numerous times in the past. We could expect this test to happen in the next 3 days, but it is uncertain whether it will result in a breakout through this line, or simply rebound back to current lines.
XAGUSD breakout through support
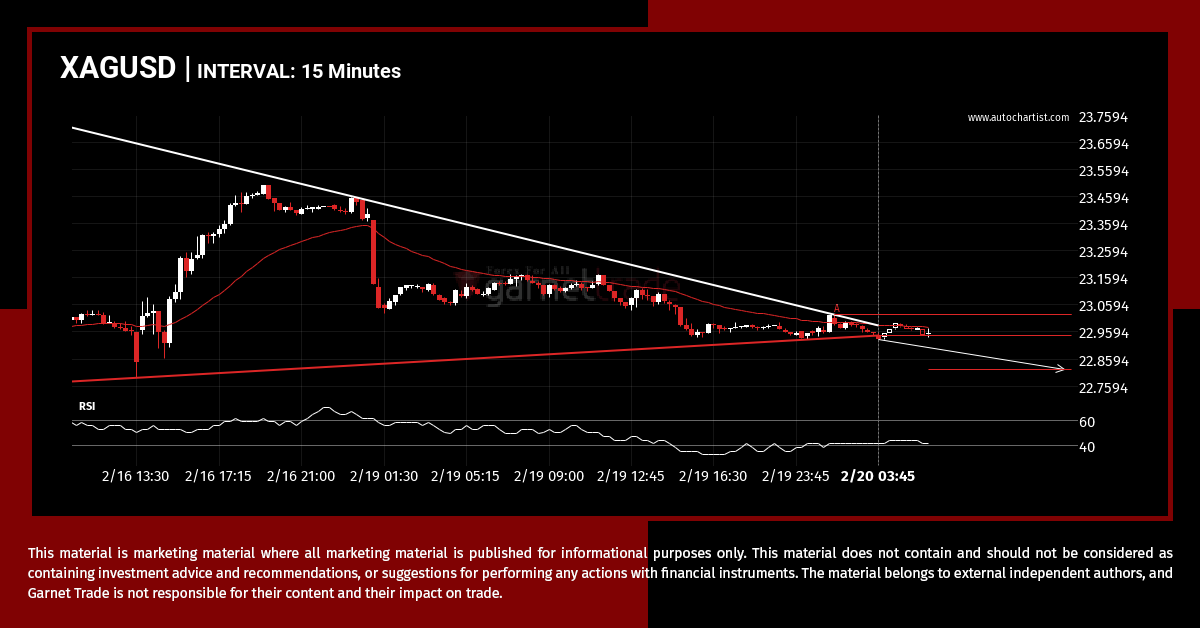
XAGUSD moved through the support line of a Triangle at 22.945918032786885 on the 15 Minutes chart. This line has been tested a number of times in the past and this breakout could mean an upcoming change from the current trend. It may continue in its current direction toward 22.8214.
A potential bullish movement on EURGBP
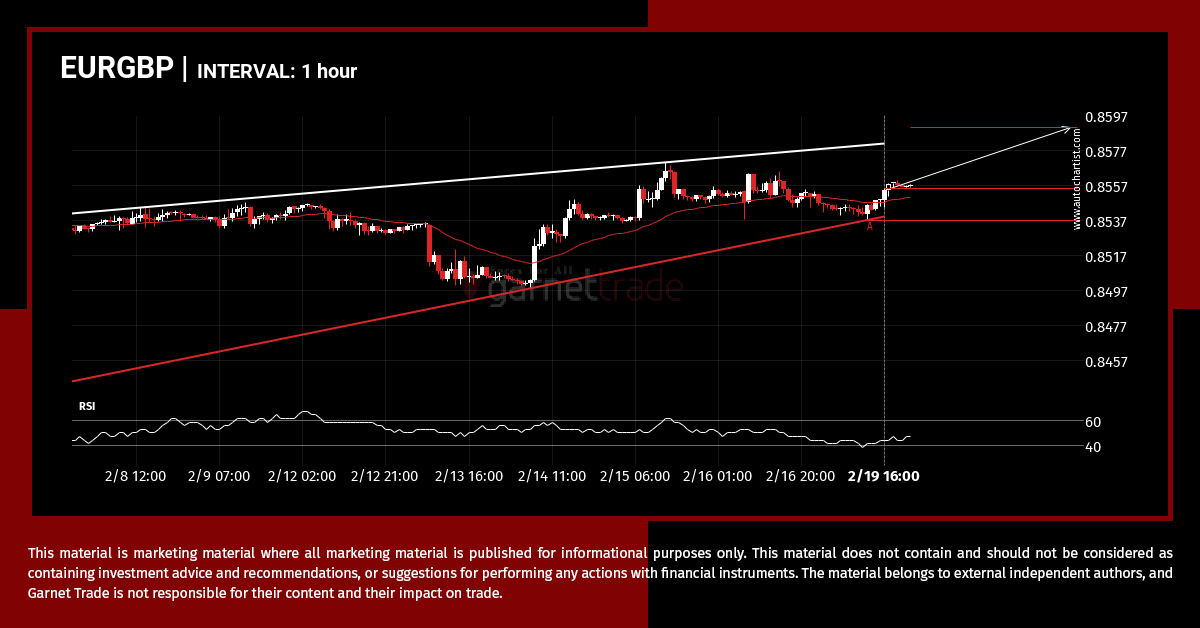
EURGBP is moving towards a resistance line. Because we have seen it retrace from this line before, we could see either a break through this line, or a rebound back to current levels. It has touched this line numerous times in the last 13 days and may test it again within the next 3 days.
UKX.IND – resistance line broken at 2024-02-16T17:00:00.000Z
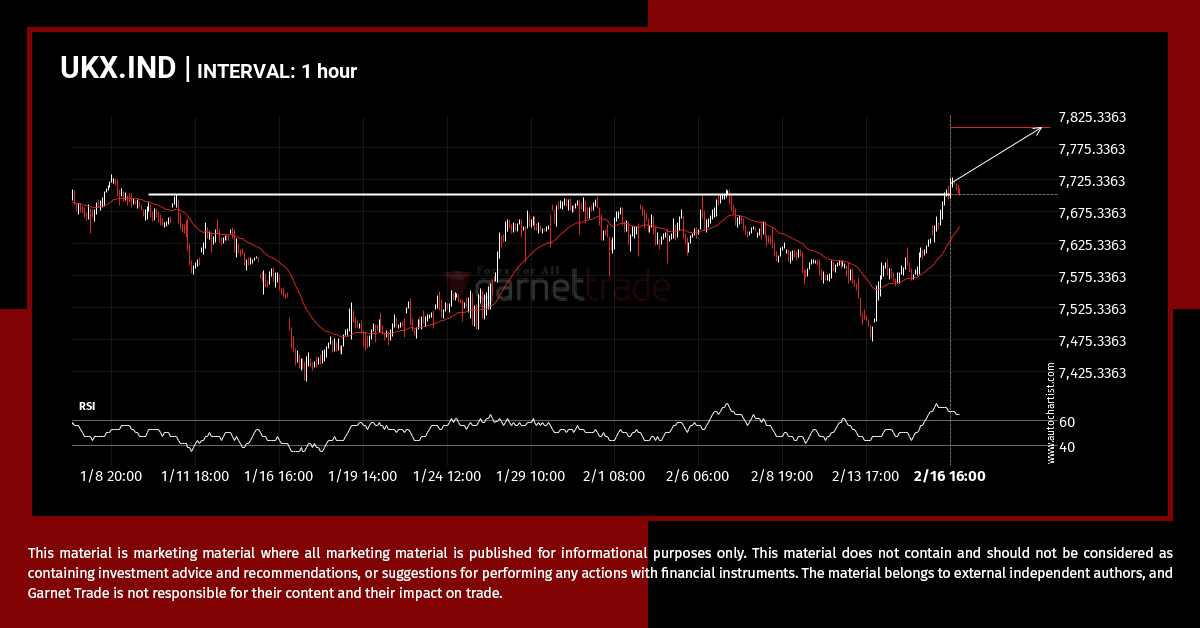
The price of UKX.IND in heading in the direction of 7805.5298. Despite the recent breakout through 7700.3999 it is possible that it will struggle to gain momentum to the forecast price and move back in the other direction. This has happened many times in the past so watch for a possible bounce back.
NDX.IND – Continuation Chart Pattern – Channel Up
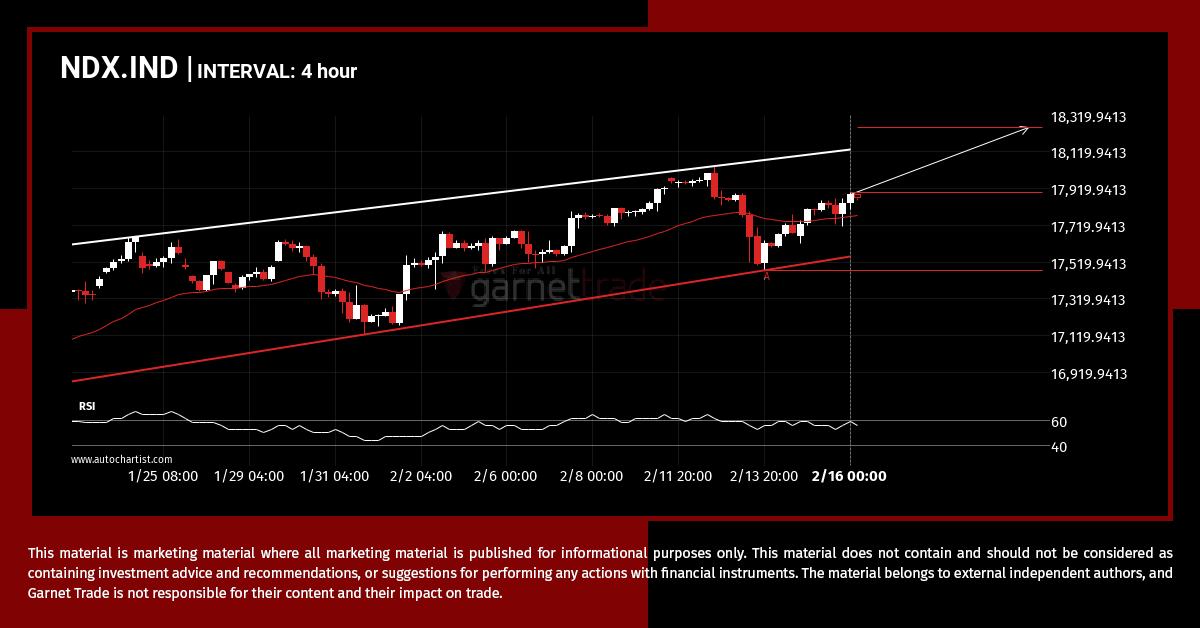
NDX.IND is moving towards a resistance line. Because we have seen it retrace from this line before, we could see either a break through this line, or a rebound back to current levels. It has touched this line numerous times in the last 30 days and may test it again within the next 3 days.