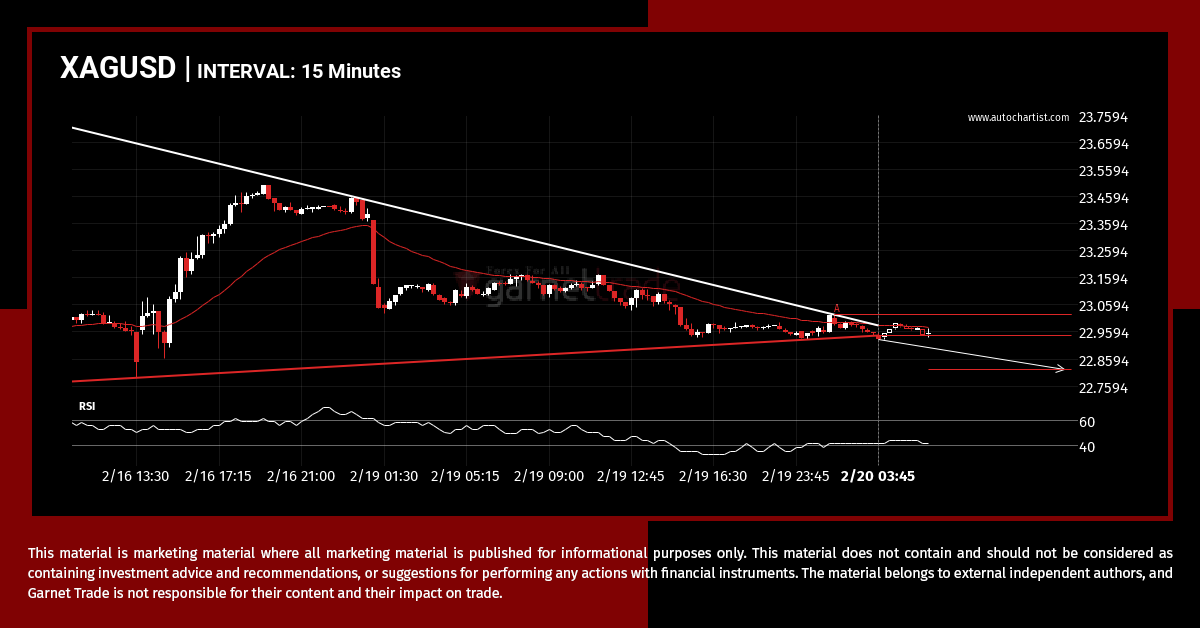
XAGUSD moved through the support line of a Triangle at 22.945918032786885 on the 15 Minutes chart. This line has been tested a number of times in the past and this breakout could mean an upcoming change from the current trend. It may continue in its current direction toward 22.8214.