A potential bullish movement on XAGUSD
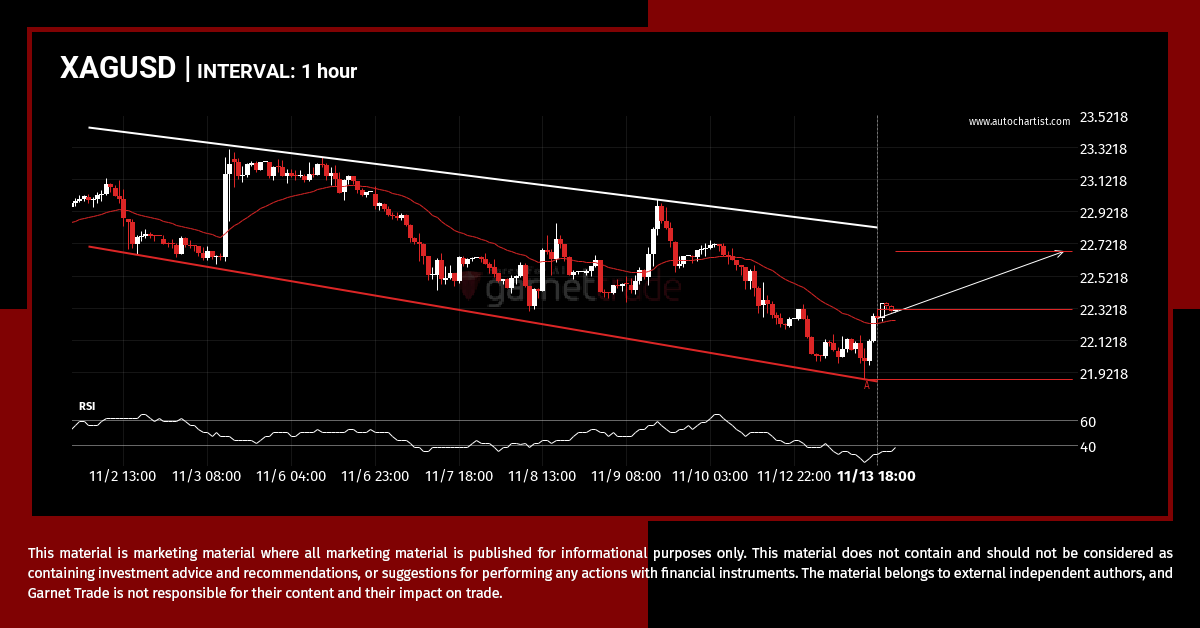
XAGUSD is moving towards a resistance line. Because we have seen it retrace from this line before, we could see either a break through this line, or a rebound back to current levels. It has touched this line numerous times in the last 12 days and may test it again within the next 3 days.
SPX.IND is moving, act now
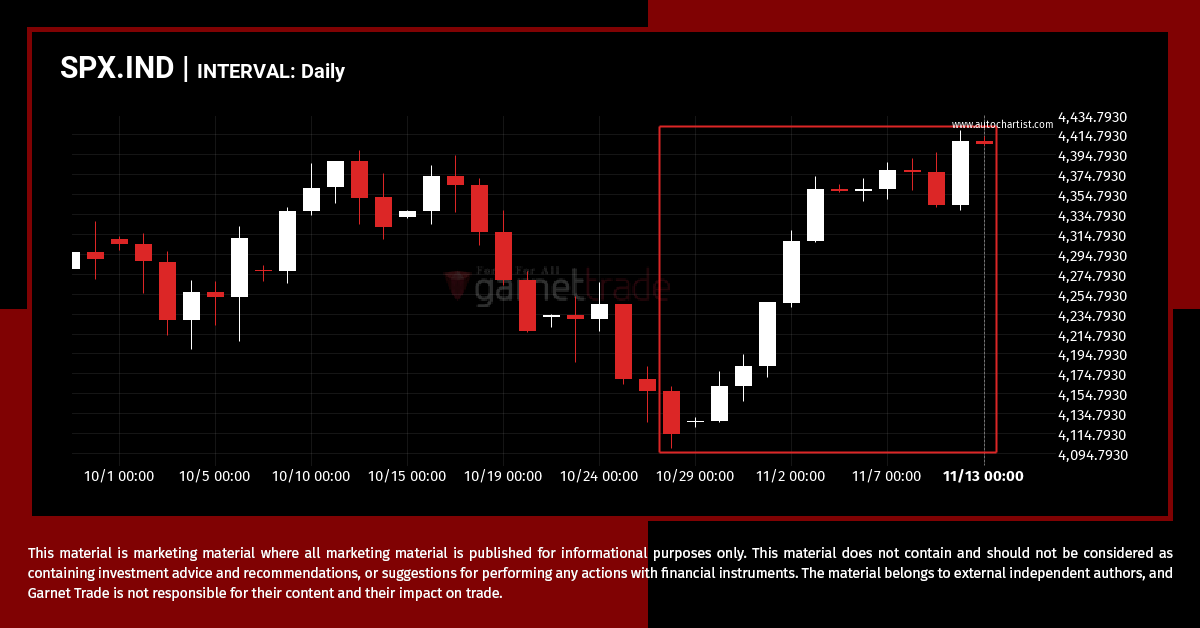
SPX.IND has moved higher by 7.07% from 4113.87 to 4404.91 in the last 18 days.
bullish technical pattern on XAUUSD 30 Minutes
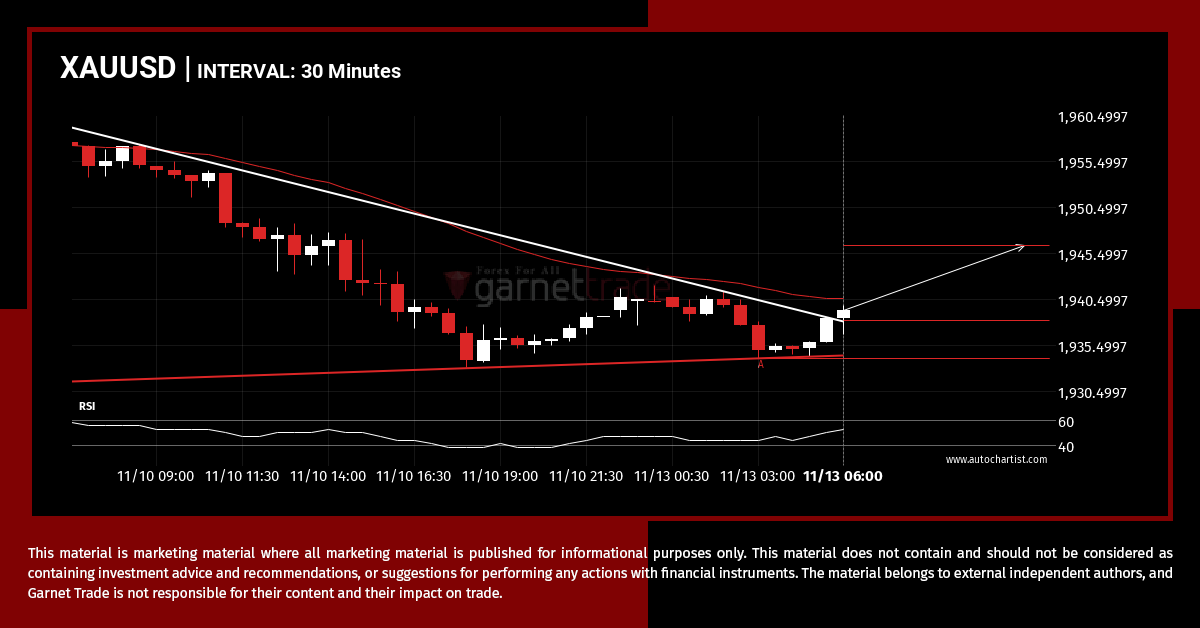
This trade steup on XAUUSD is formed by a period of consolidation; a period in which the price primarily moves sideways before choosing a new direction for the longer term. Because of the bullish breakout through resistance, it seems to suggest that we could see the next price move to 1946.3377.
EURGBP broke through important 0.8736 price line
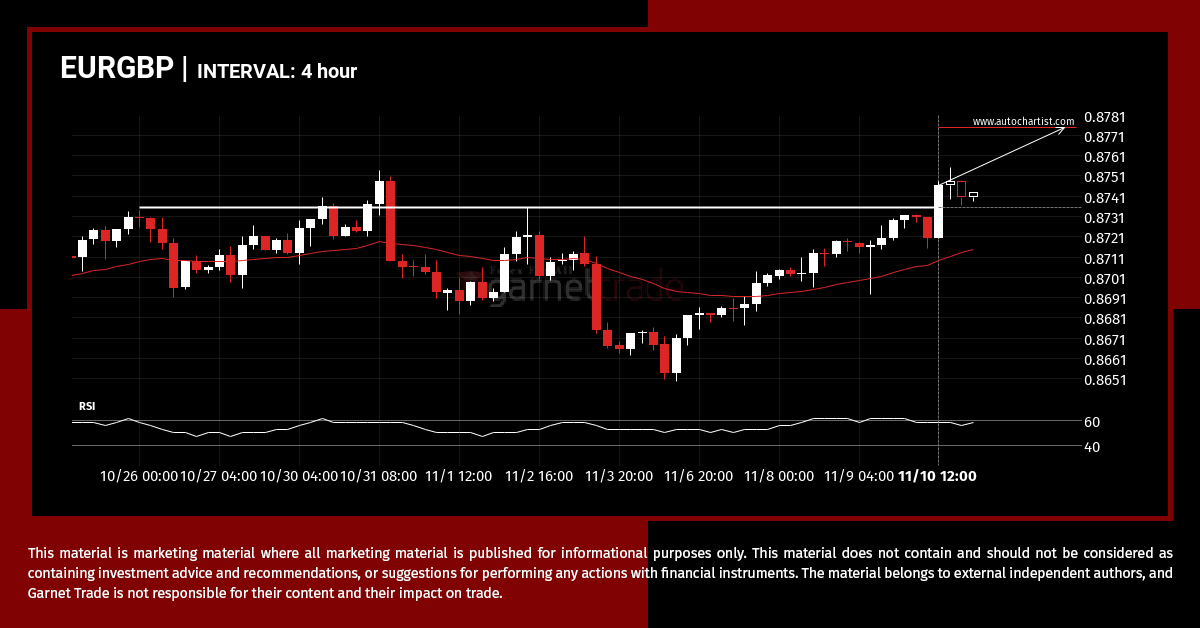
EURGBP is once again retesting a key horizontal resistance level at 0.8736. It has tested this level 3 times in the recent past and could simply bounce off like it did last time. However, after this many tries, maybe it’s ready to start a new trend.
Possible start of a bearish trend as UKX.IND breaks support
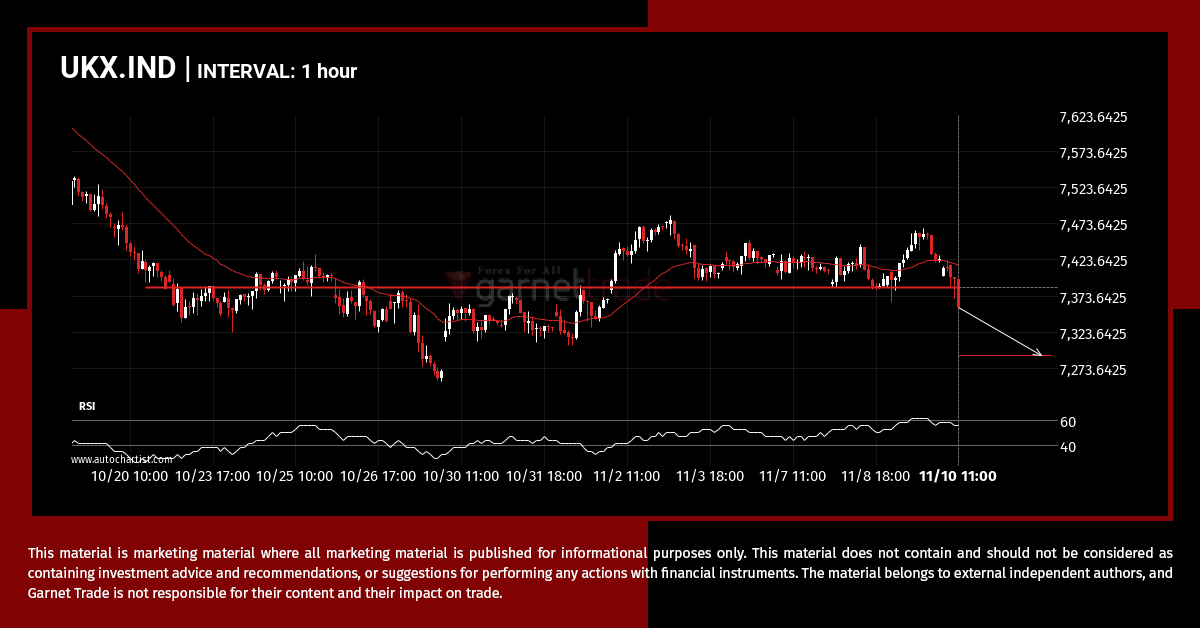
UKX.IND has broken through a line of 7385.2998 and suggests a possible movement to 7291.9102 within the next 3 days. It has tested this line numerous times in the past, so one should wait for a confirmation of this breakout before taking any action. If the breakout doesn’t confirm, we could see a retracement back […]
USDCAD – Large movement, a rare opportunity
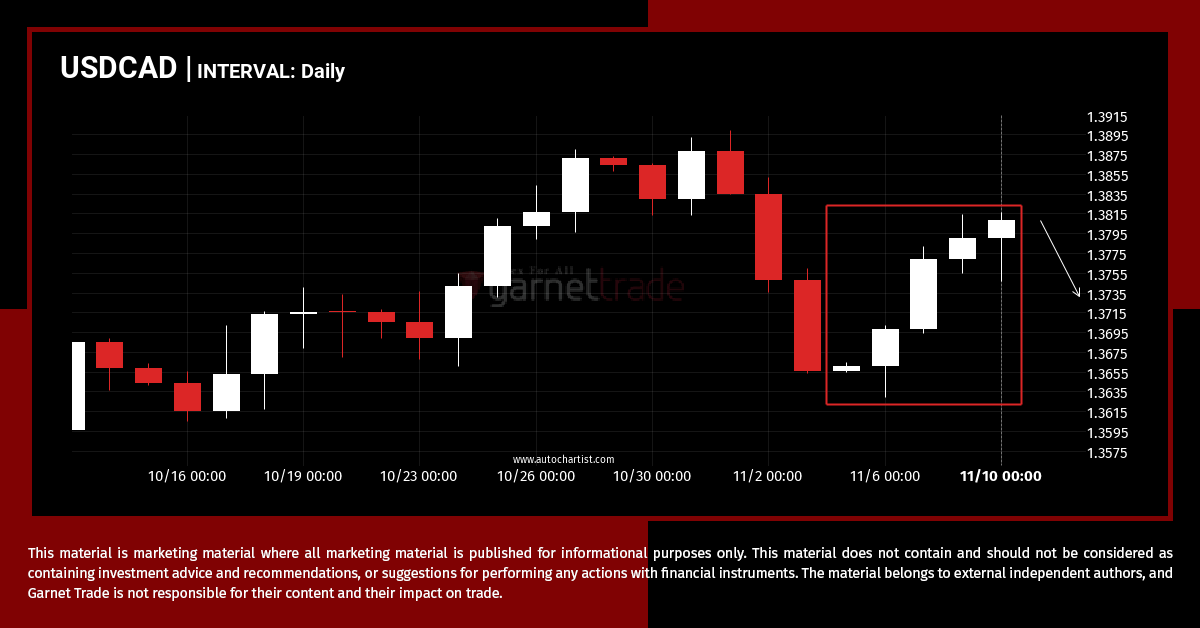
USDCAD has experienced an exceptionally large amount of consecutive bullish candles to reach a price of 1.3809 in the last 6 days.
SPX.IND approaching resistance of a Flag
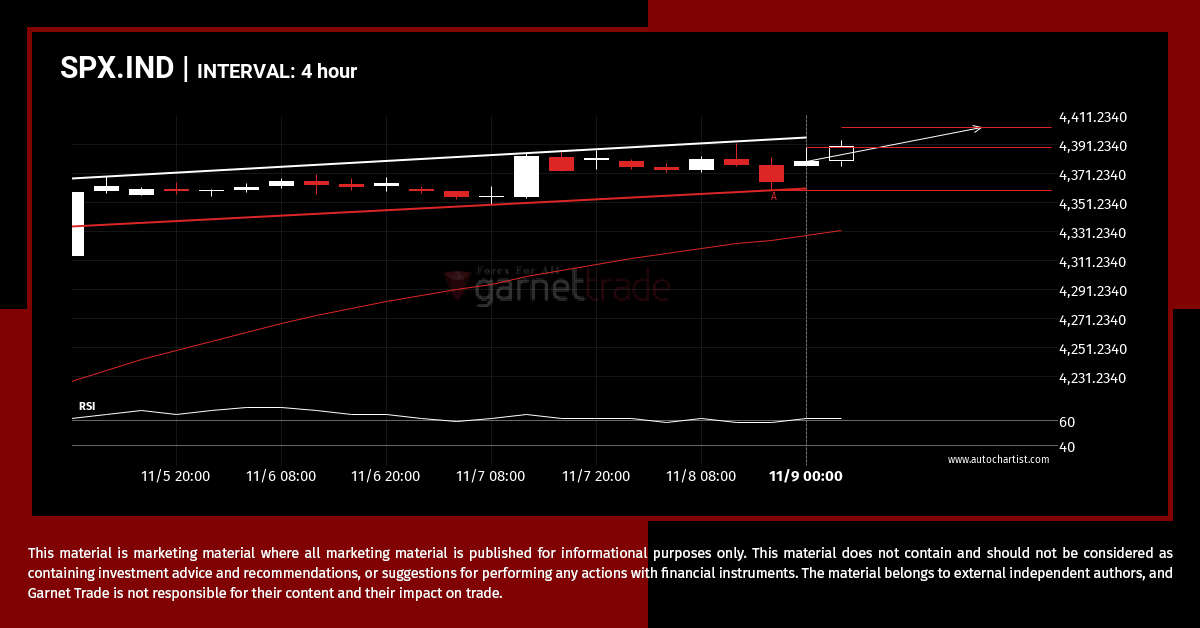
SPX.IND is moving towards a resistance line. Because we have seen it retrace from this line before, we could see either a break through this line, or a rebound back to current levels. It has touched this line numerous times in the last 8 days and may test it again within the next 12 hours.
4 consecutive daily bearish candles on XAGUSD
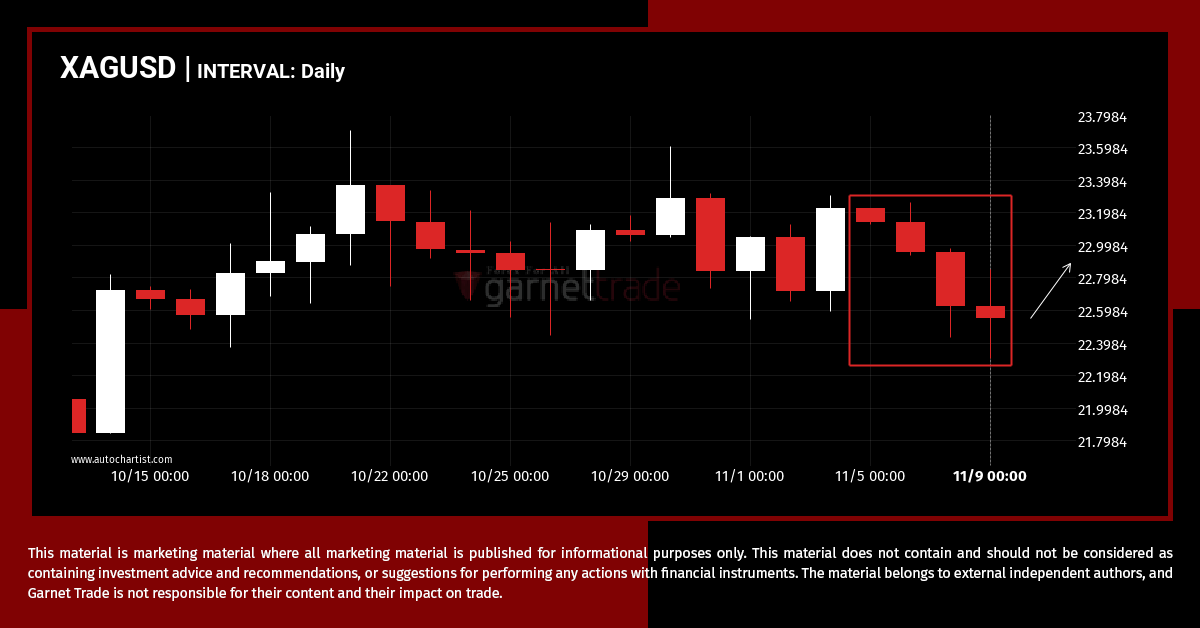
XAGUSD has experienced an exceptionally large amount of consecutive bearish candles to reach a price of 22.5480 in the last 5 days.
EURGBP – psychological price line breached
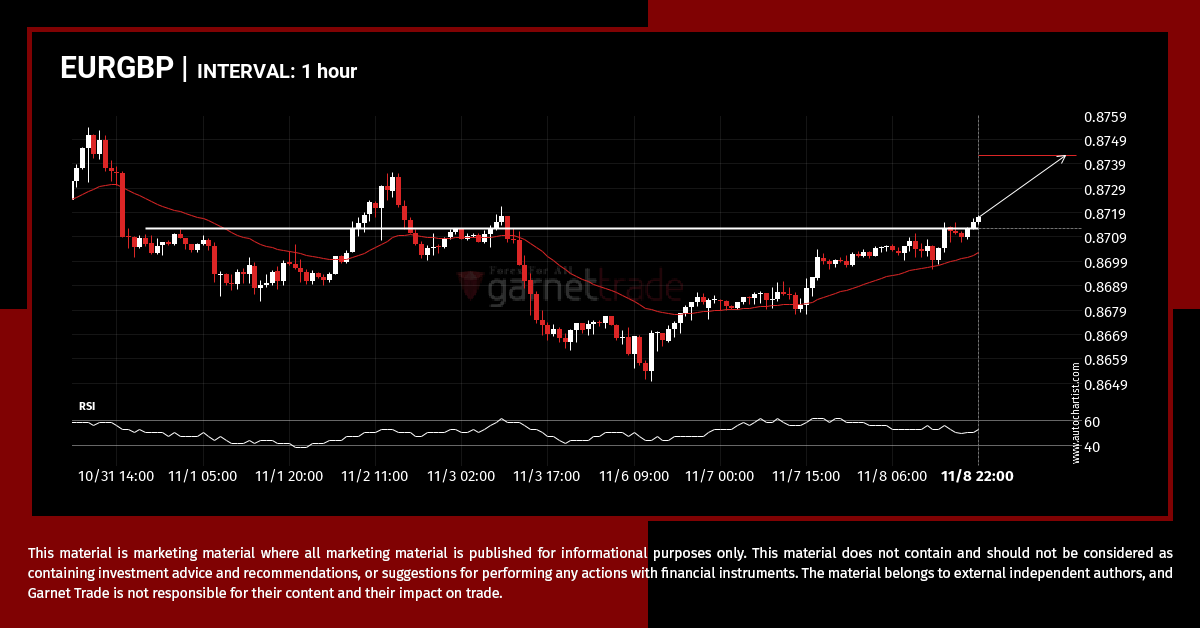
EURGBP is once again retesting a key horizontal resistance level at 0.8713. It has tested this level 5 times in the recent past and could simply bounce off like it did last time. However, after this many tries, maybe it’s ready to start a new trend.
AUDUSD – getting close to support of a Head and Shoulders
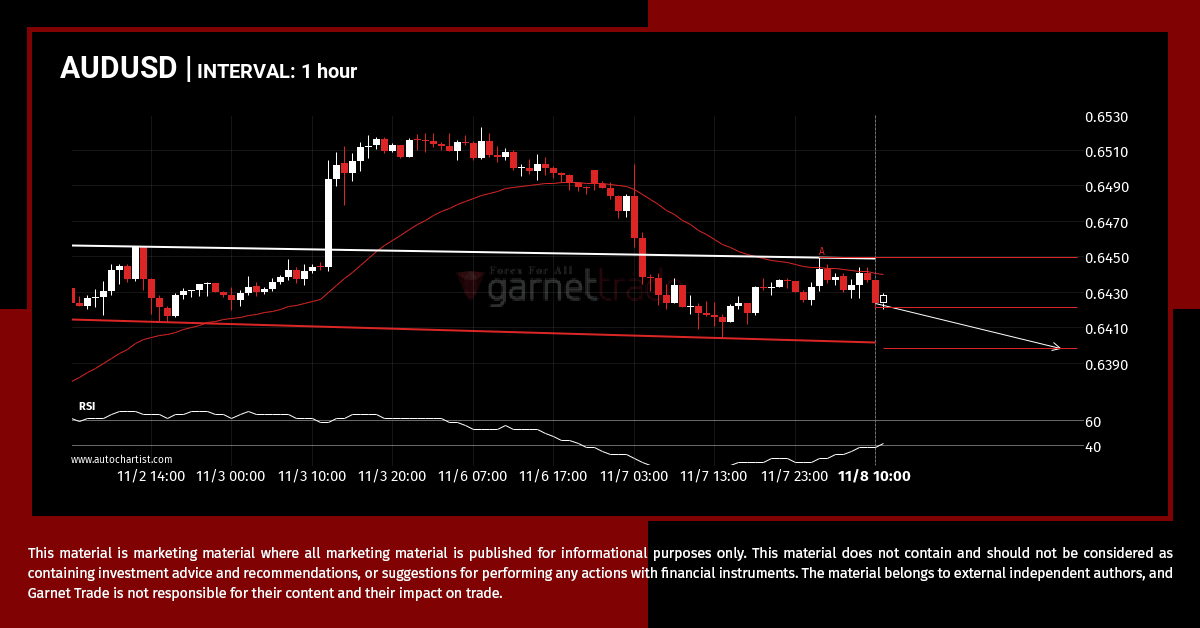
AUDUSD is heading towards the support line of a Head and Shoulders and could reach this point within the next 2 days. It has tested this line numerous times in the past, and this time could be no different from the past, ending in a rebound instead of a breakout. If the breakout doesn’t happen, […]

