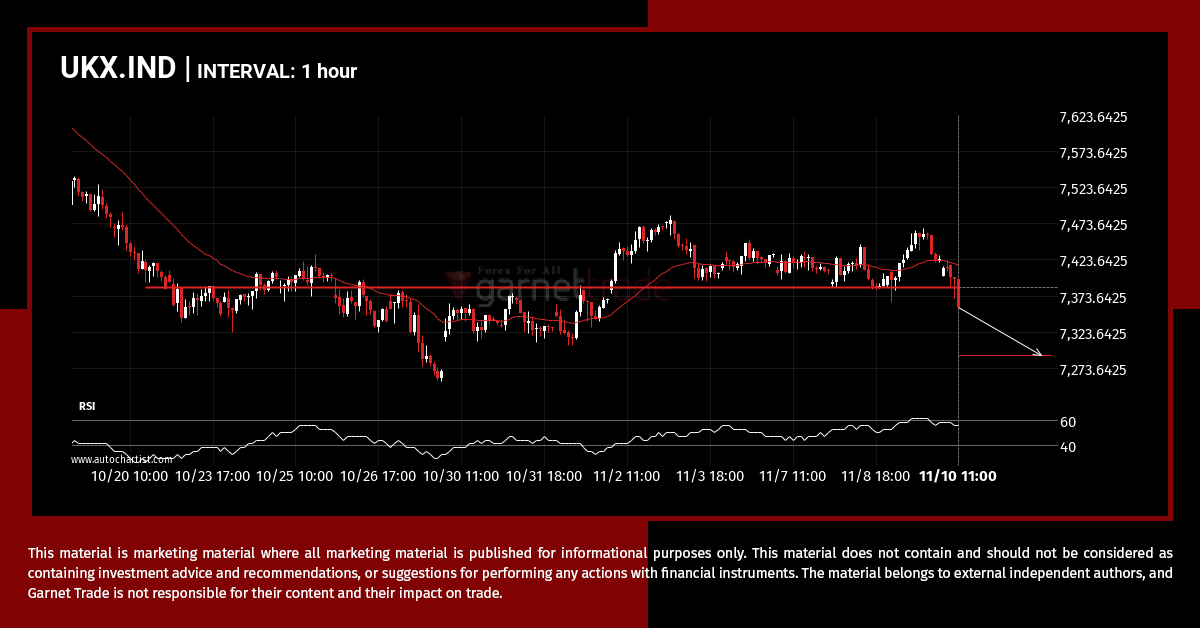
UKX.IND has broken through a line of 7385.2998 and suggests a possible movement to 7291.9102 within the next 3 days. It has tested this line numerous times in the past, so one should wait for a confirmation of this breakout before taking any action. If the breakout doesn’t confirm, we could see a retracement back to lines seen in the last 21 days.