Is NDX.IND likely to correct after consecutive bullish candles?
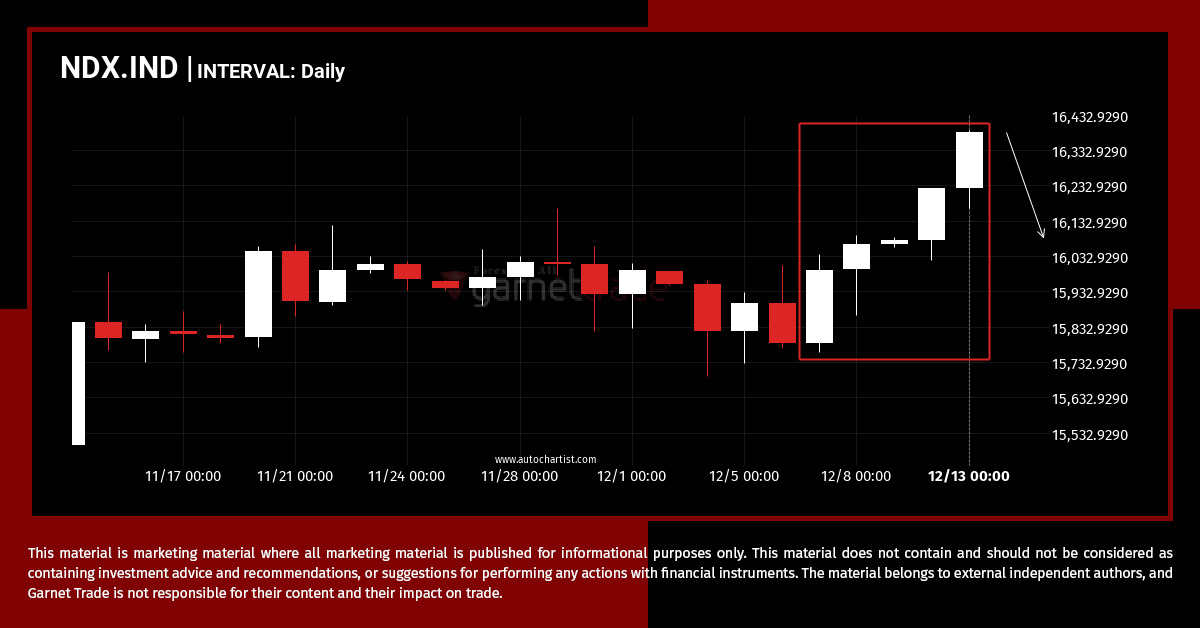
Trend followers are probably eagerly watching NDX.IND to see if its latest 5 consecutive candles continues. If not, the mean-reversion people out there will be delighted with this exceptionally large 7 day move.
Dramatic change in XAUUSD. A sign of things to come?
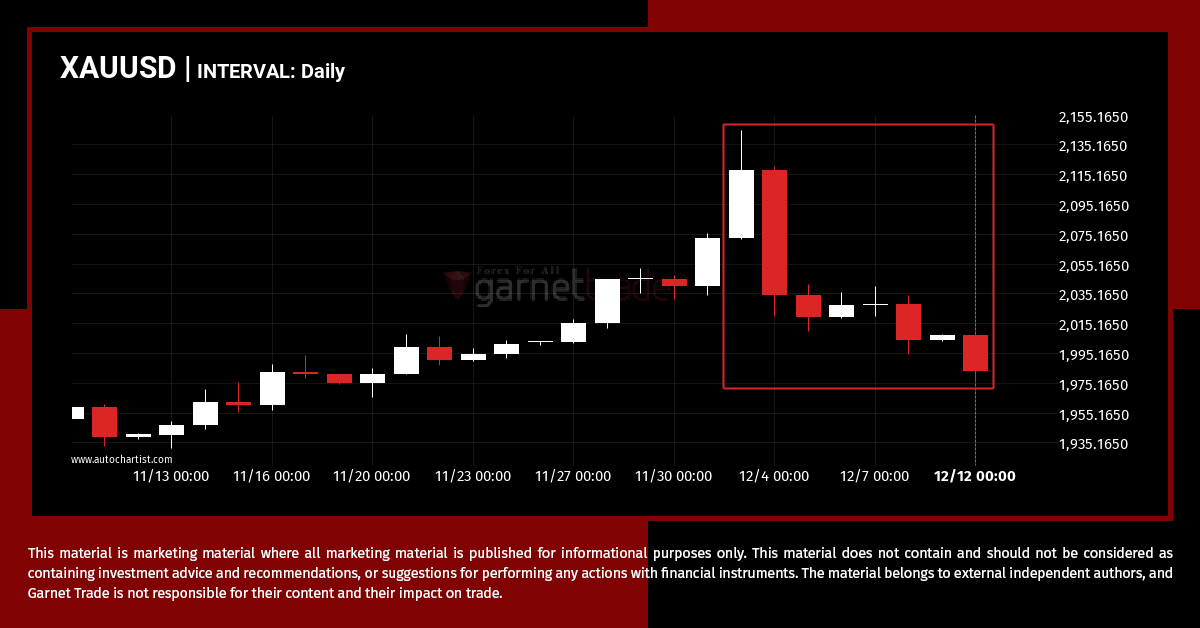
XAUUSD dropped sharply for 9 days – which is an excessively big movement for this instrument; exceeding the 98% of past price moves. Even if this move is a sign of a new trend in XAUUSD there is a chance that we will witness a correction, no matter how brief.
GBPUSD – support line broken at 2023-12-12T10:30:00.000Z
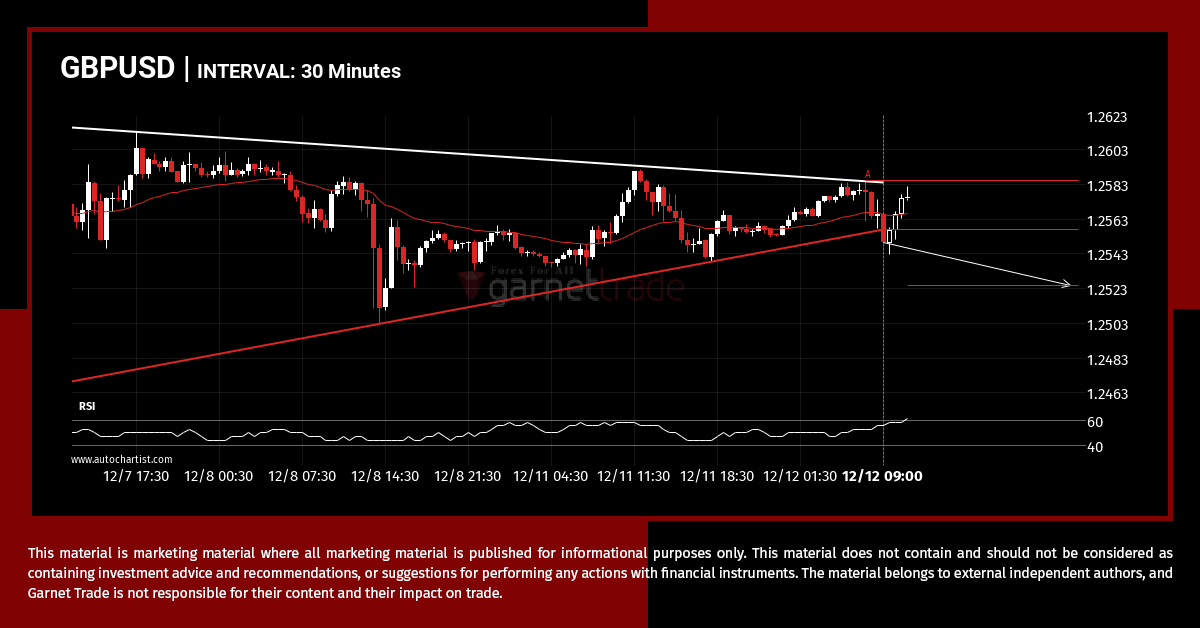
GBPUSD moved through the support line of a Triangle at 1.2556839285714285 on the 30 Minutes chart. This line has been tested a number of times in the past and this breakout could mean an upcoming change from the current trend. It may continue in its current direction toward 1.2525.
A potential bearish movement on USDCHF
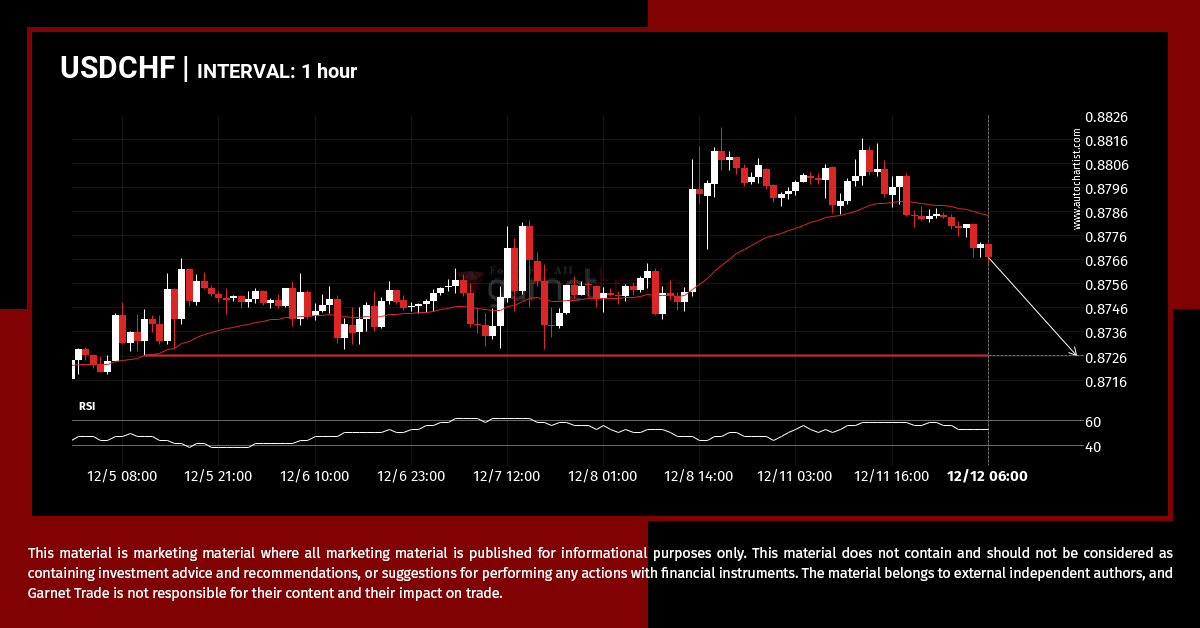
USDCHF is en route to a very important line that will be a definite deciding factor of what is to come! We may see this trajectory continue to touch and break through 0.8726, unless it runs out of momentum and pulls back to current levels.
DAX.IND was on its way up
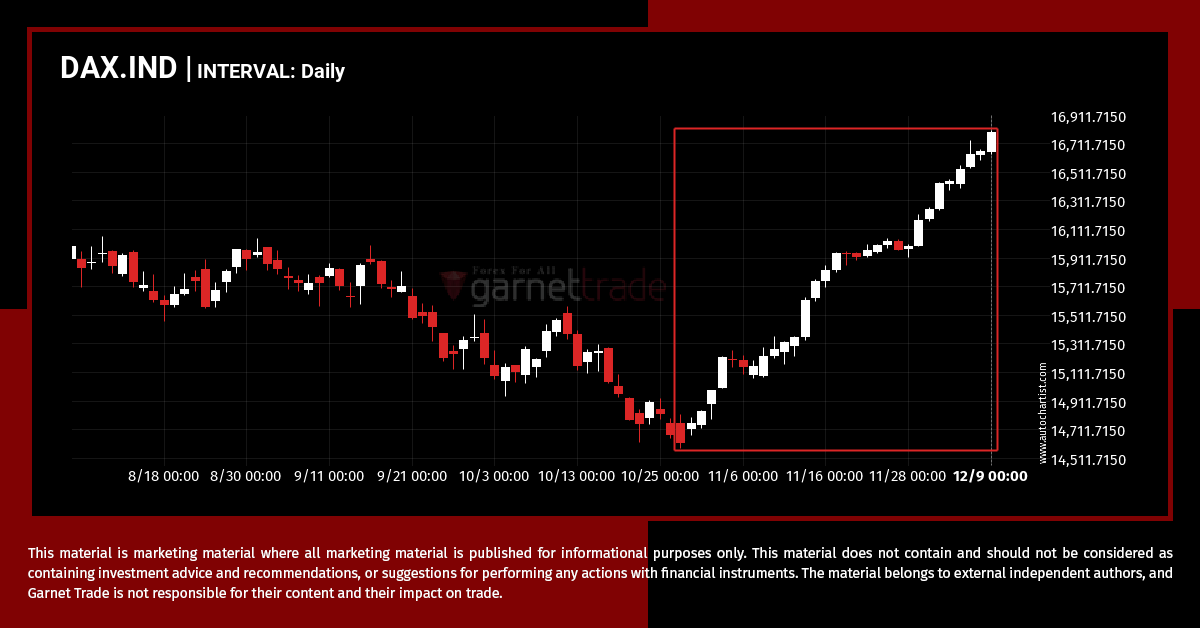
DAX.IND has experienced an exceptionally large movement higher by 14.87% from 14618.3 to 16791.8 in the last 44 days.
A potential bearish movement on AUDUSD
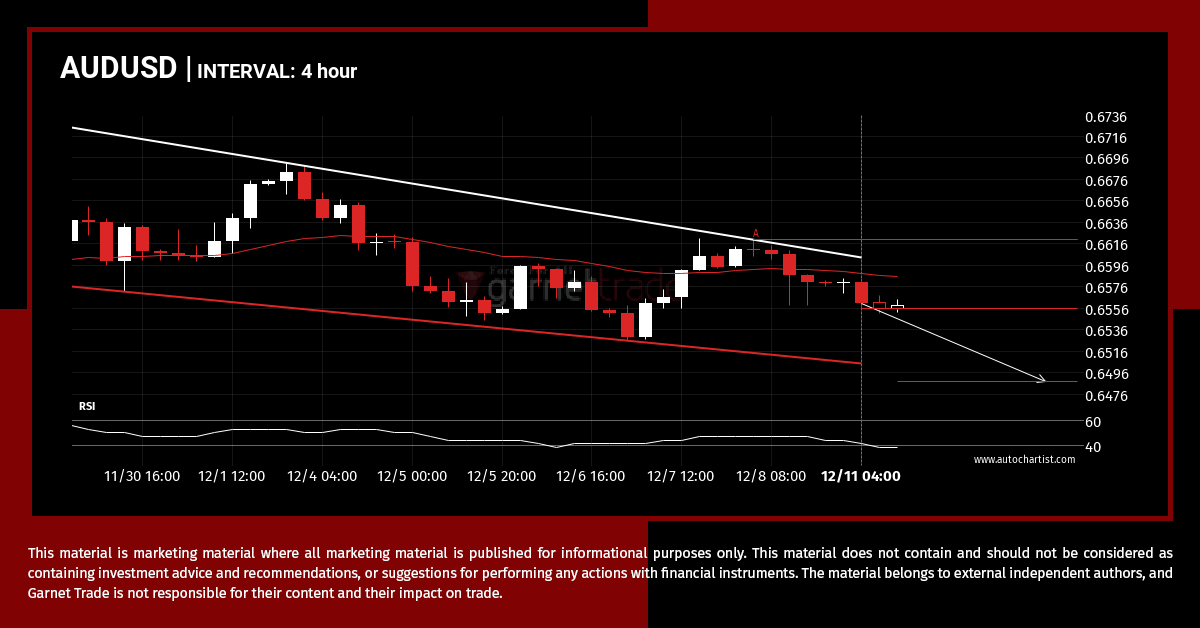
AUDUSD is moving towards a support line which it has tested numerous times in the past. We have seen it retrace from this line before, so at this stage it isn’t clear whether it will breach this line or rebound as it did before. If AUDUSD continues in its current trajectory, we could see it […]
Possible start of a bullish trend as NDX.IND breaks resistance
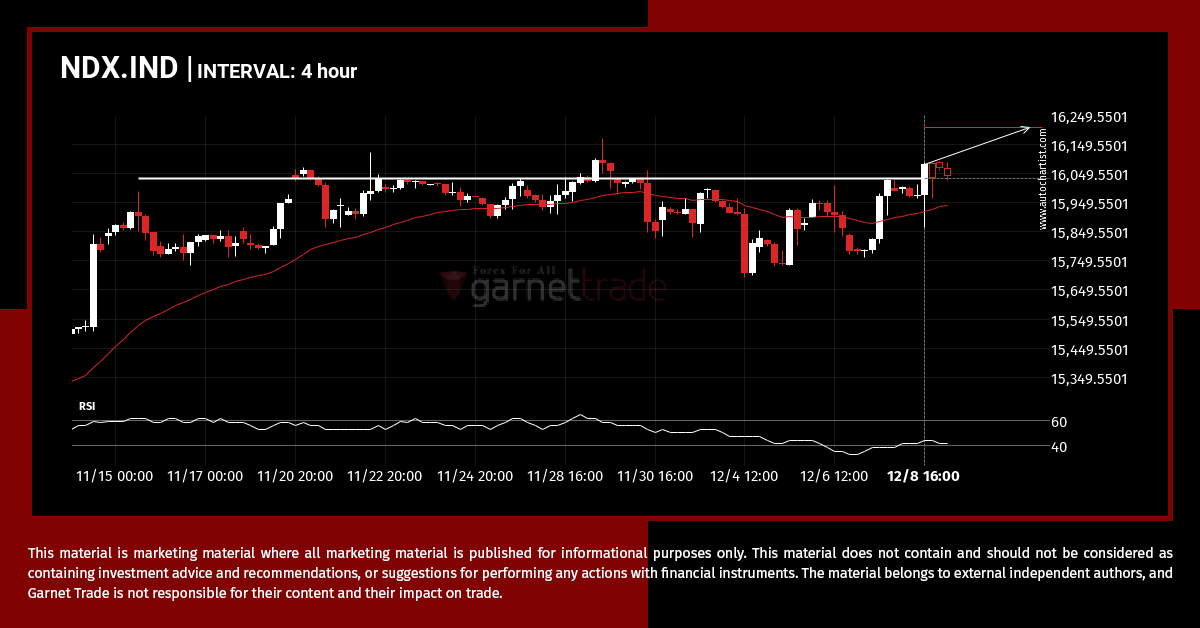
NDX.IND has broken through 16033.1699 which it has tested numerous times in the past. We have seen it retrace from this price in the past. If this new trend persists, NDX.IND may be heading towards 16206.0400 within the next 2 days.
EURGBP is on its way down
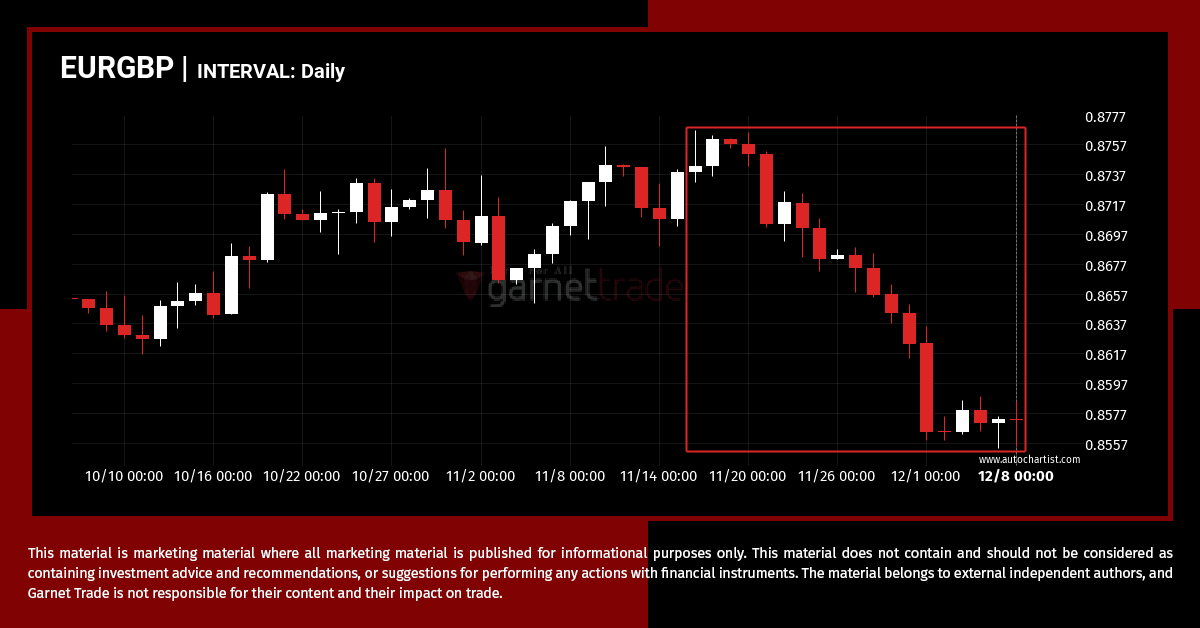
EURGBP has moved lower by 1.95% from 0.87424 to 0.85719 in the last 23 days.
Will GBPUSD have enough momentum to break support?
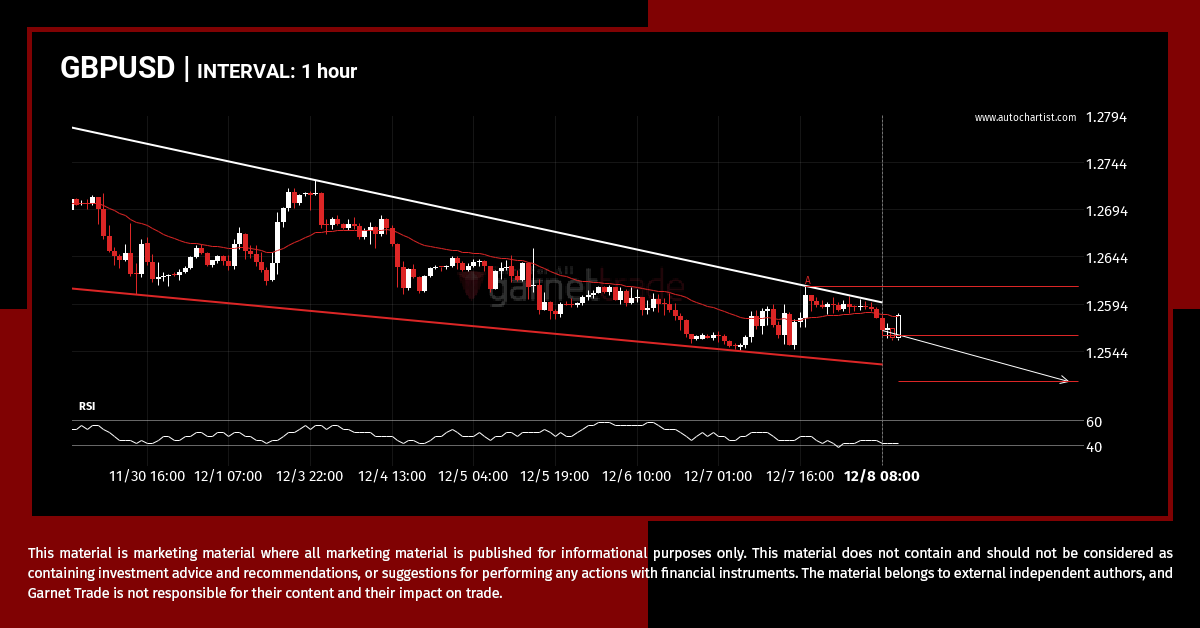
A Falling Wedge pattern was identified on GBPUSD at 1.25605, creating an expectation that it may move to the support line at 1.2512. It may break through that line and continue the bearish trend or it may reverse from that line.
XAUUSD breakout through resistance
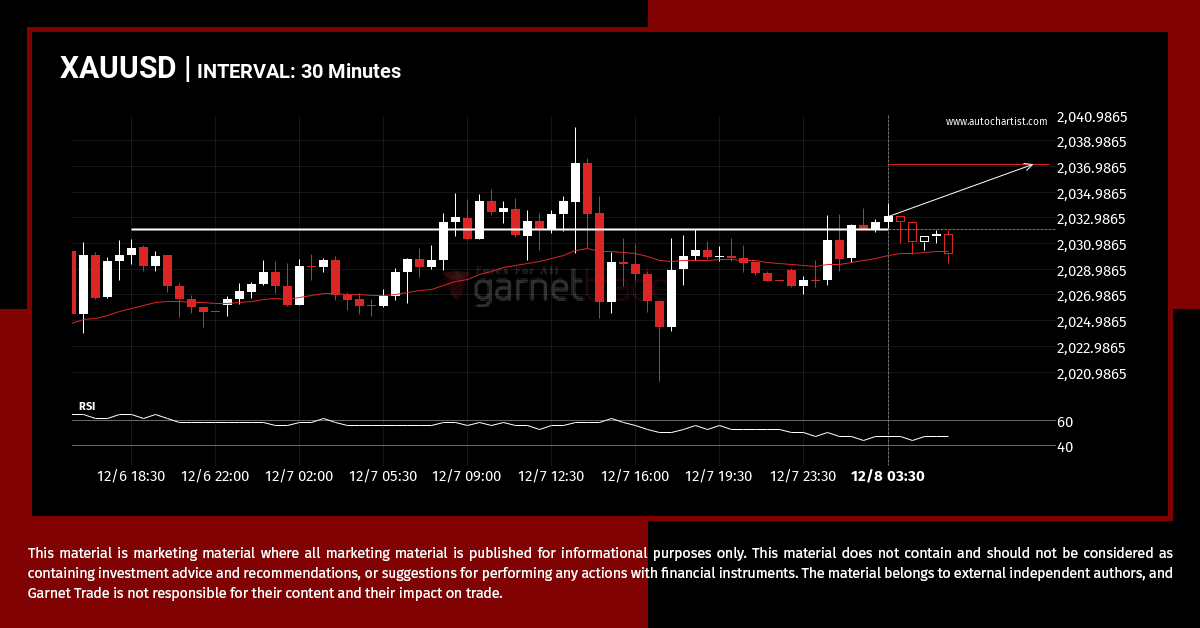
The breakout of XAUUSD through the 2032.0500 price line is a breach of an important psychological price that is has tested numerous in the past. If this breakout persists, XAUUSD could test 2037.1121 within the next 5 hours. One should always be cautious before placing a trade, wait for confirmation of the breakout.

