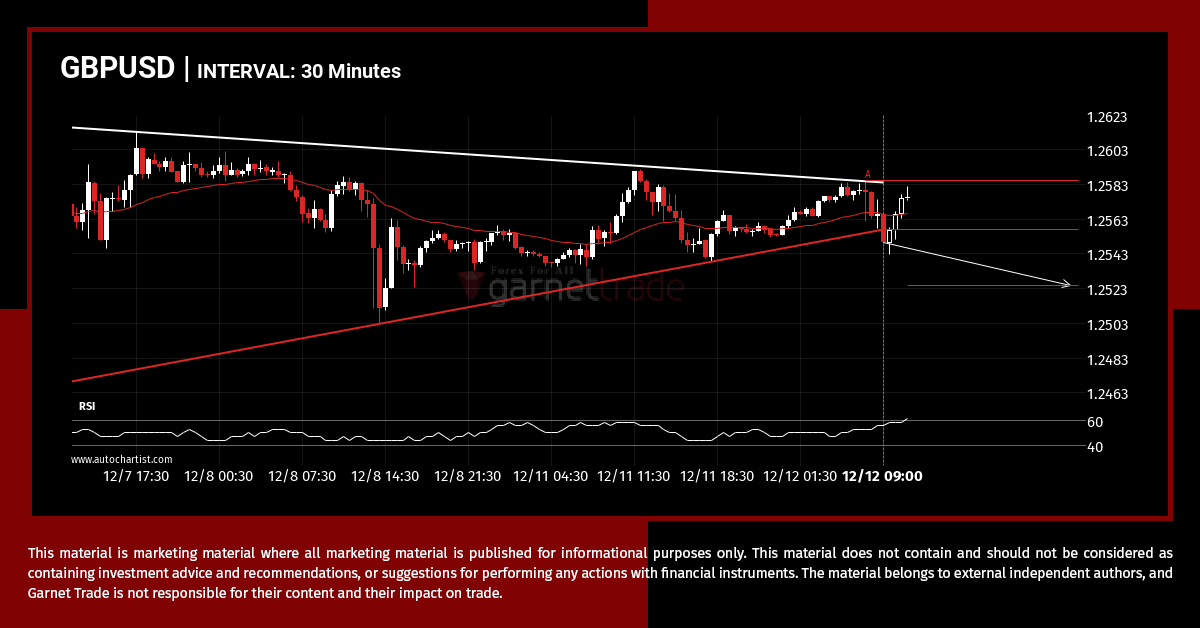
GBPUSD moved through the support line of a Triangle at 1.2556839285714285 on the 30 Minutes chart. This line has been tested a number of times in the past and this breakout could mean an upcoming change from the current trend. It may continue in its current direction toward 1.2525.