
Big movement possible on USDCHF
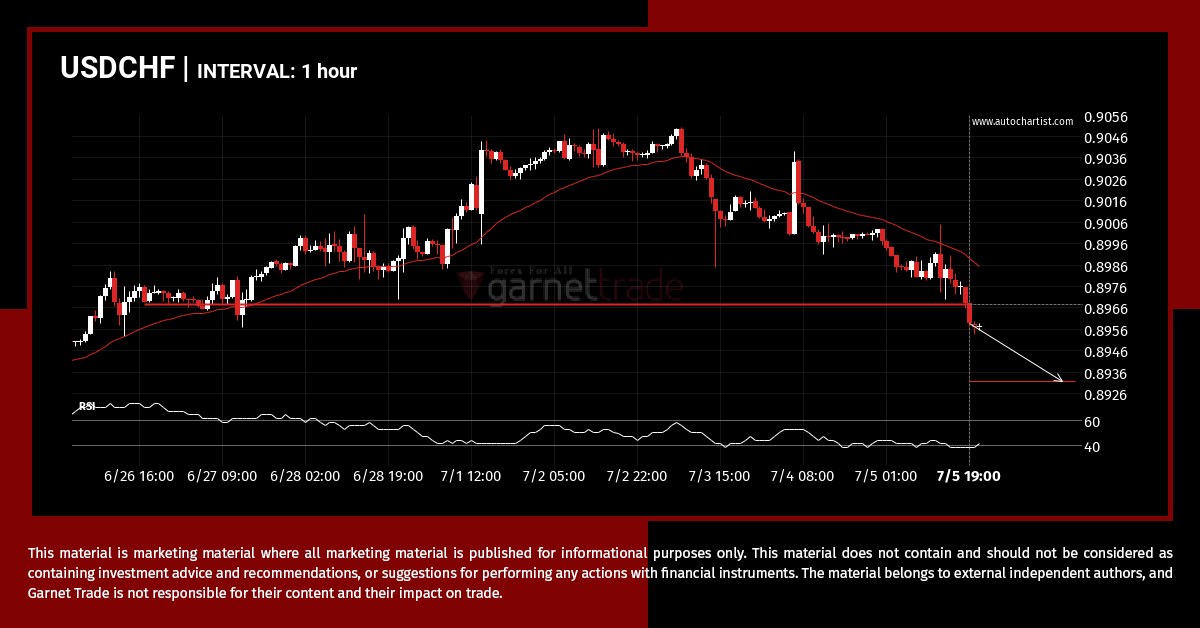
The breakout of USDCHF through the 0.8968 price line is a breach of an important psychological price that is has tested numerous in the past. If this breakout persists, USDCHF could test 0.8932 within the next 2 days. One should always be cautious before placing a trade, wait for confirmation of the breakout.
Possible breach of resistance level by XAUUSD
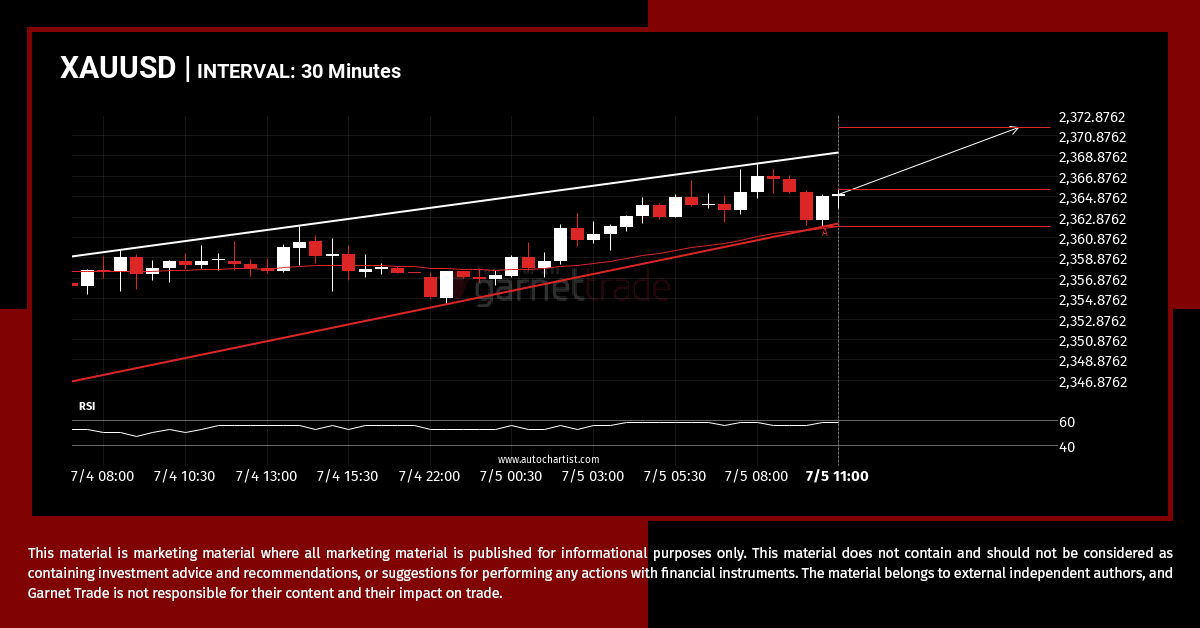
The movement of XAUUSD towards the resistance line of a Rising Wedge is yet another test of the line it reached numerous times in the past. This line test could happen in the next 7 hours, but it is uncertain whether it will result in a breakout through this line, or simply rebound back to […]
Possible start of a bullish trend on XAGUSD
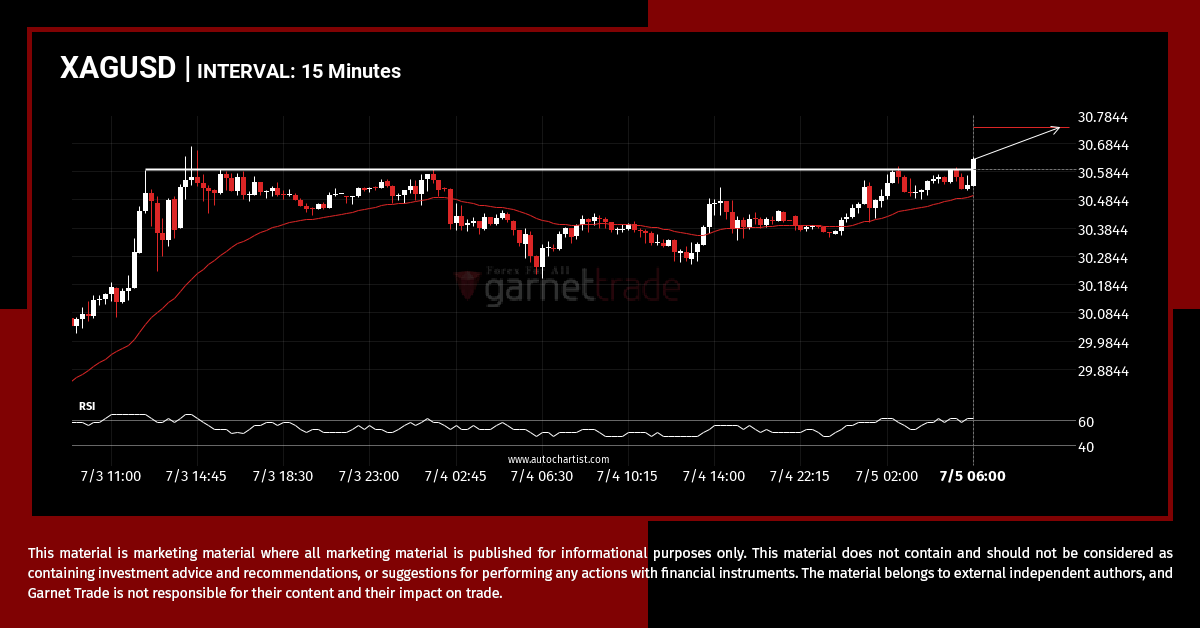
XAGUSD has broken through a resistance line. It has touched this line numerous times in the last 2 days. This breakout shows a potential move to 30.7395 within the next 9 hours. Because we have seen it retrace from this level in the past, one should wait for confirmation of the breakout.
Rare opportunity on DAX.IND – extreme bullish movement
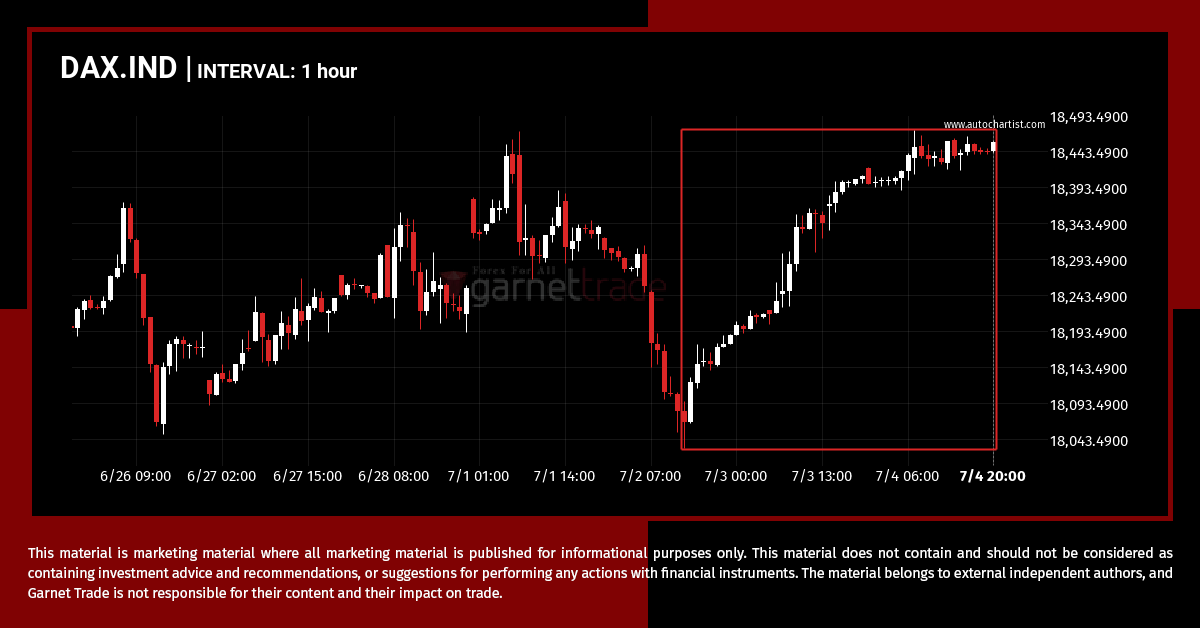
A movement of 2.15% over 3 days on DAX.IND doesn’t go unnoticed. You may start considering where it’s heading next, a continuation of the current upward trend, or a reversal in the previous direction.
bullish technical pattern on AUDUSD 4 hour
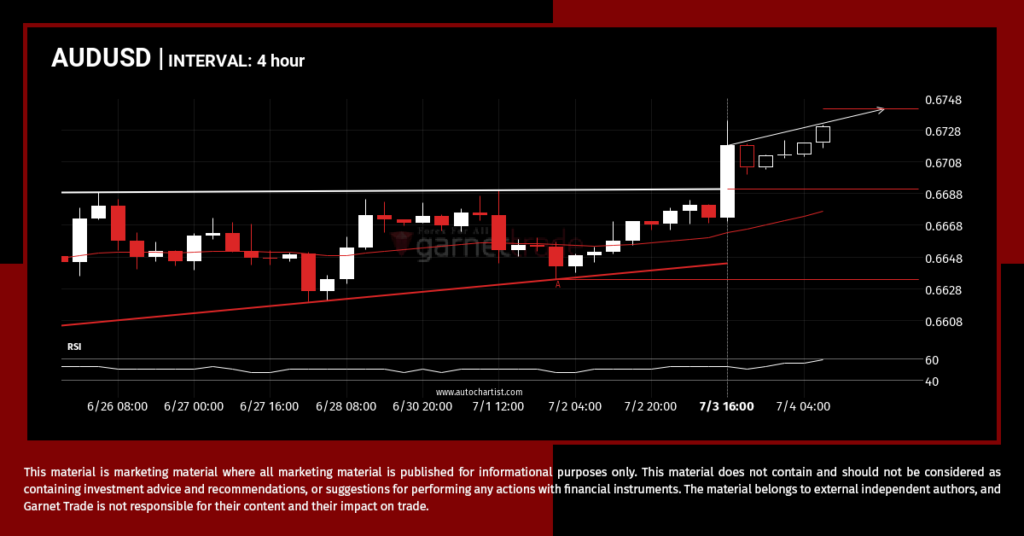
The last 10 4 hour candles on AUDUSD formed a Ascending Triangle pattern and broken out through the pattern lines, indicating a possible bullish movement towards the price level of 0.6741.
EURGBP approaching important level of 0.8429
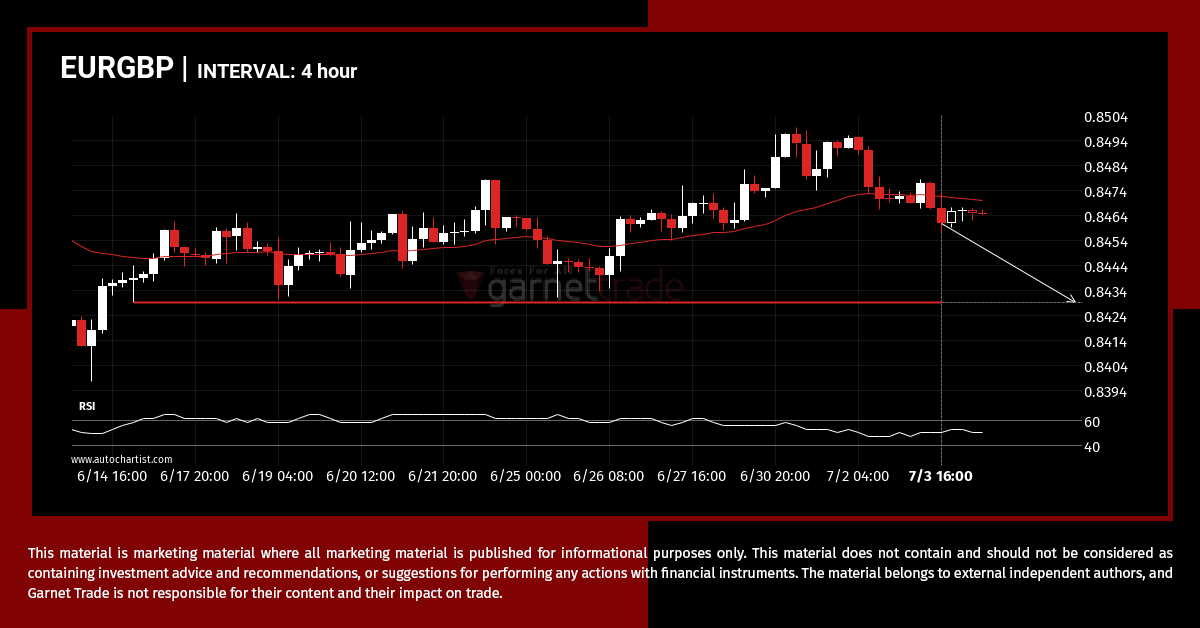
EURGBP is moving towards a key support level at 0.8429. EURGBP has previously tested this level 3 times and on each occasion it has bounced back off this level. Is this finally the time it will break through?
There was a bullish move on DAX.IND
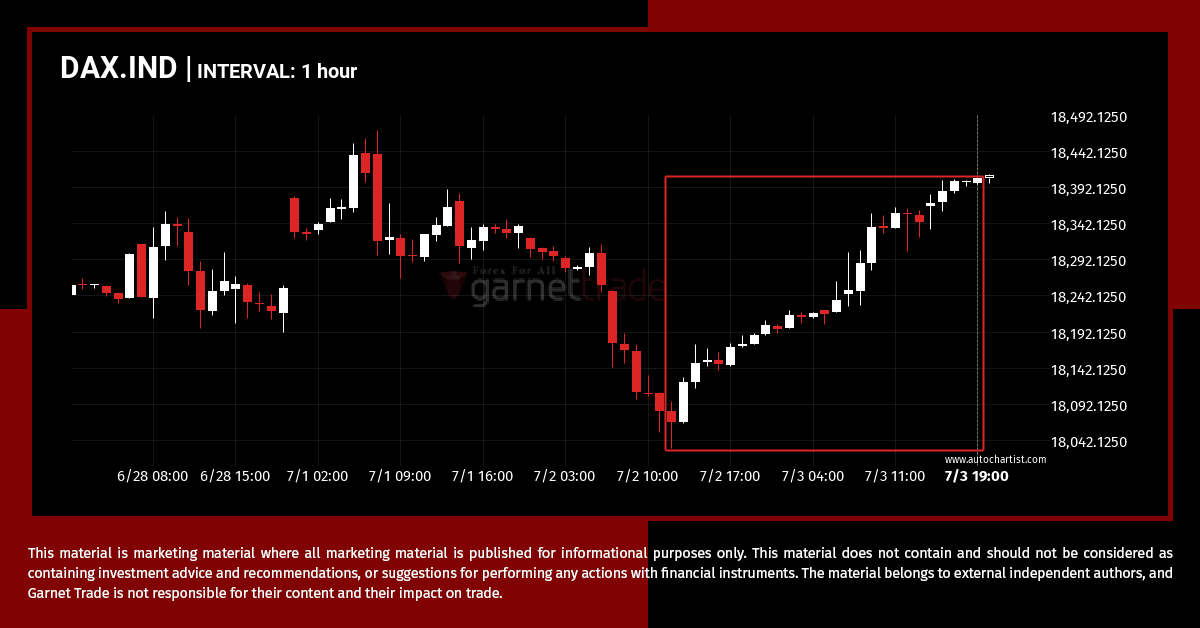
DAX.IND has moved higher by 1.87% from 18066.7 to 18403.9 in the last 2 days.
A potential bullish movement on GBPUSD
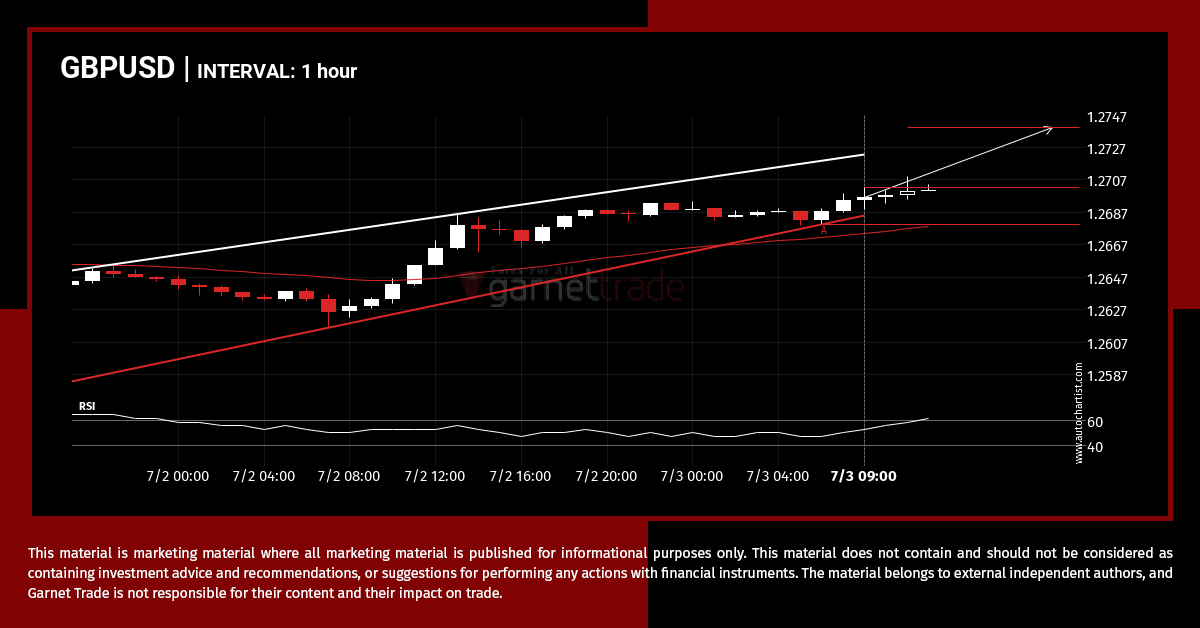
Emerging Rising Wedge pattern in its final wave was identified on the GBPUSD 1 hour chart. After a strong bullish run, we find GBPUSD heading towards the upper triangle line with a possible resistance at 1.2739. If the resistance shows to hold, the Rising Wedge pattern suggests a rebound back towards current levels.
What’s going on with USDCHF?
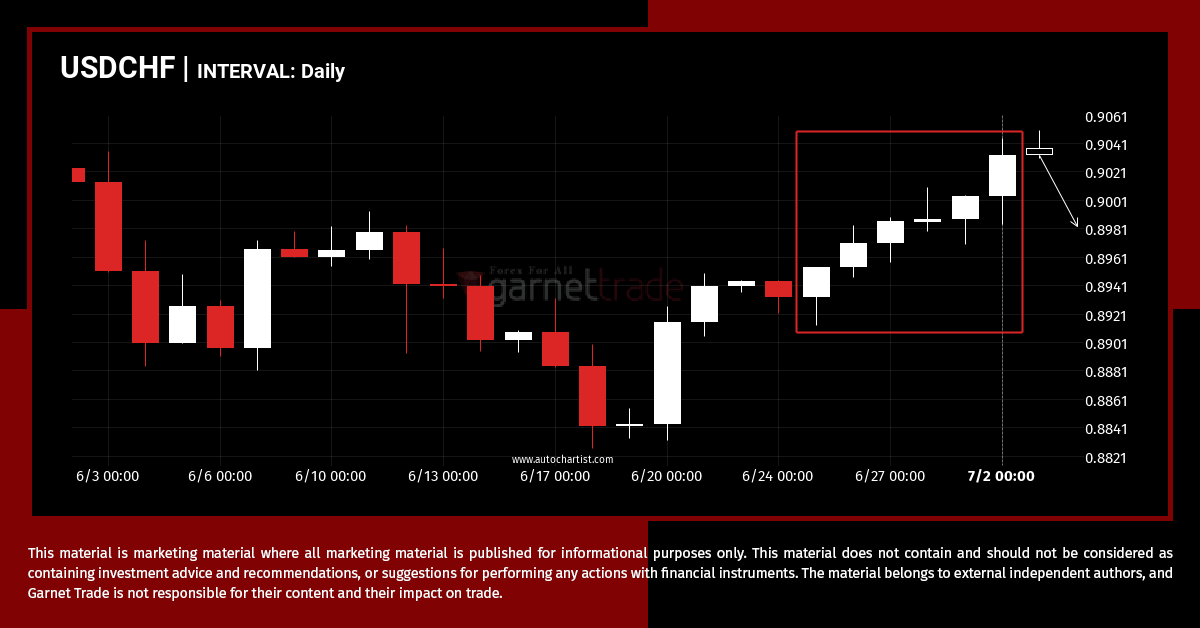
Rare set of consecutive candles on the USDCHF Daily chart. Could we expect a turn around from 0.9033 or will this movement continue?
Resistance breakout on SPX.IND
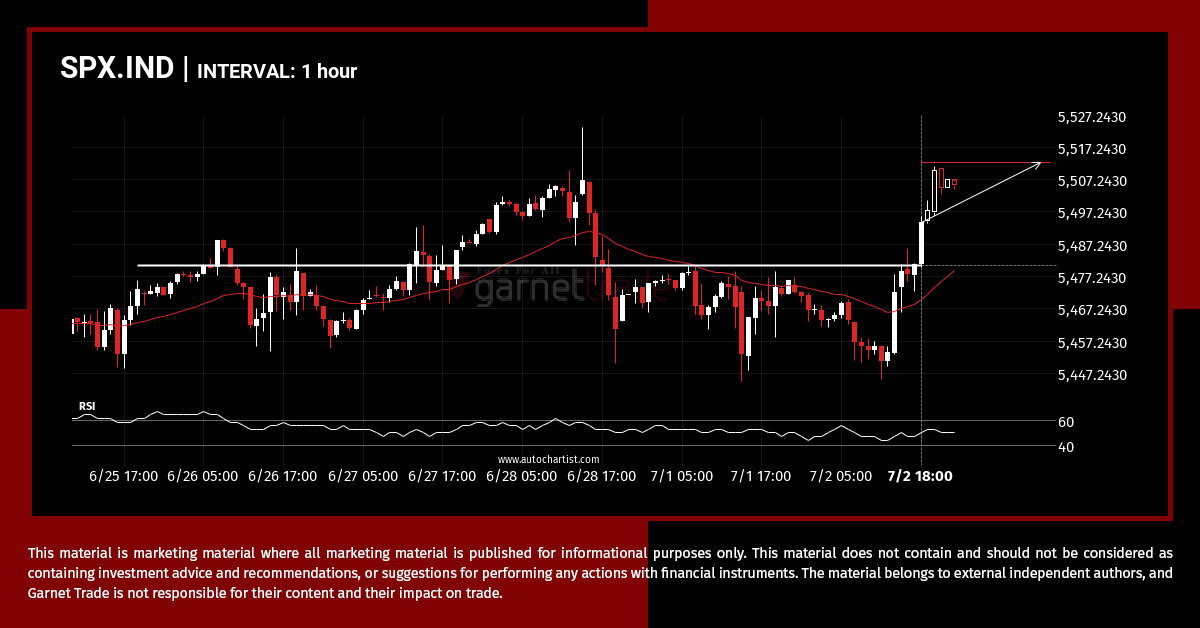
SPX.IND has broken through 5480.7100 which it has tested numerous times in the past. We have seen it retrace from this price in the past. If this new trend persists, SPX.IND may be heading towards 5512.4170 within the next 2 days.