
Will EURGBP bounce after a massive drop?
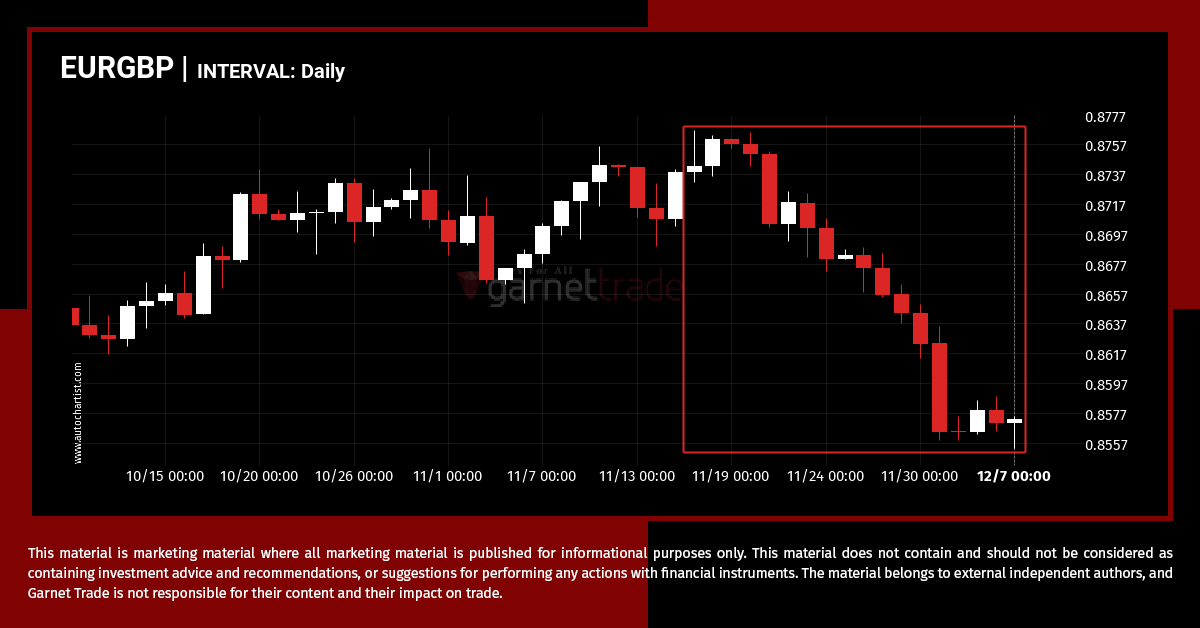
Those of you that are trend followers are probably eagerly watching EURGBP to see if its latest 1.94% move continues. If not, the mean-reversion people out there will be delighted with this exceptionally large 22 days move.
Confirmed breakout on XAGUSD 30 Minutes chart
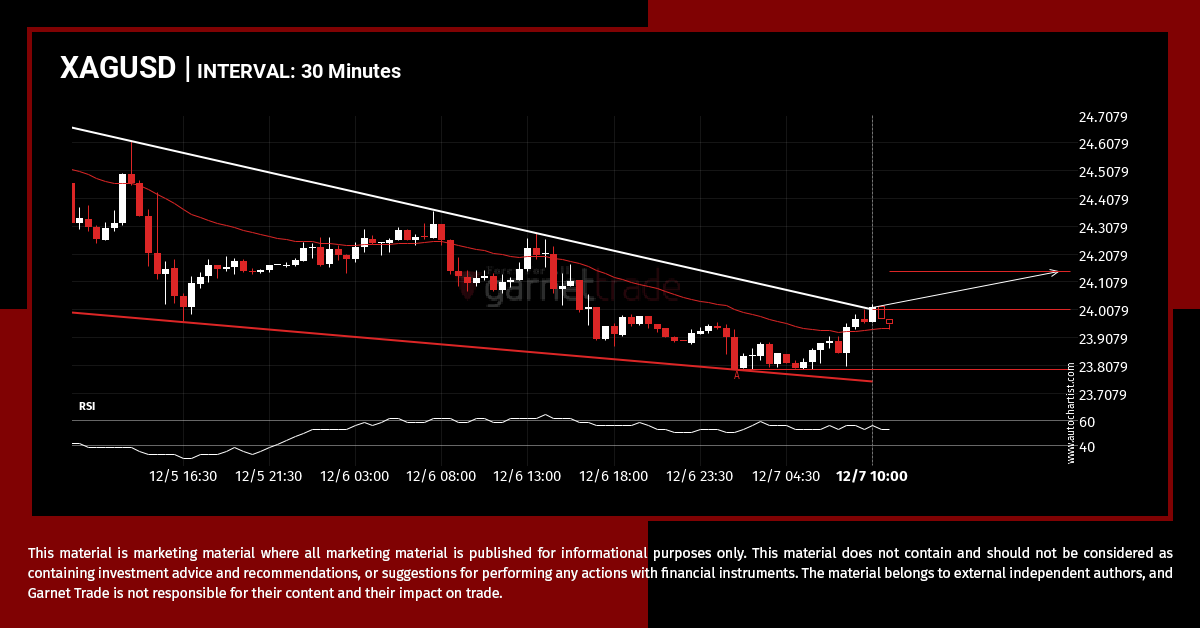
You would be well advised to confirm the breakout that has just occurred – do you believe the move through resistance to be significant? Do you have confirming indicators that the price momentum will continue? If so, look for a target of 24.1444 but consider reducing the size of your position as the price gets […]
USDCHF – getting close to psychological price line
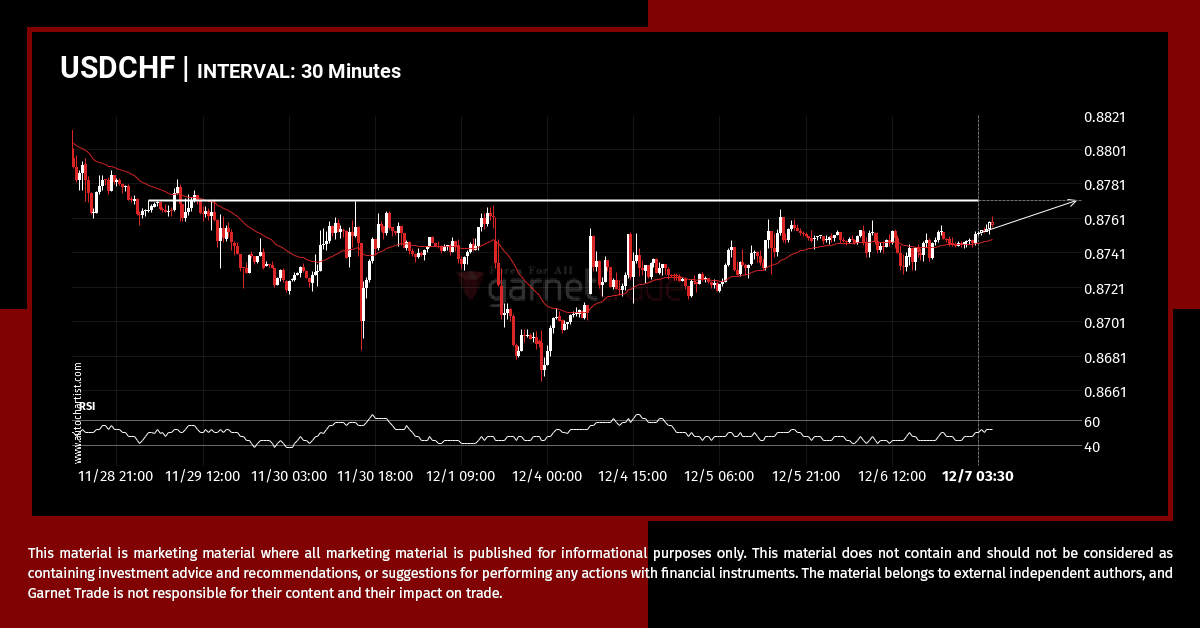
The price of USDCHF in heading back to the resistance area. It is possible that it will struggle to break through it and move back in the other direction. The price may eventually break through, but typically the price retreats from the level a number of times before doing so.
Huge movement on DAX.IND, did you miss it?
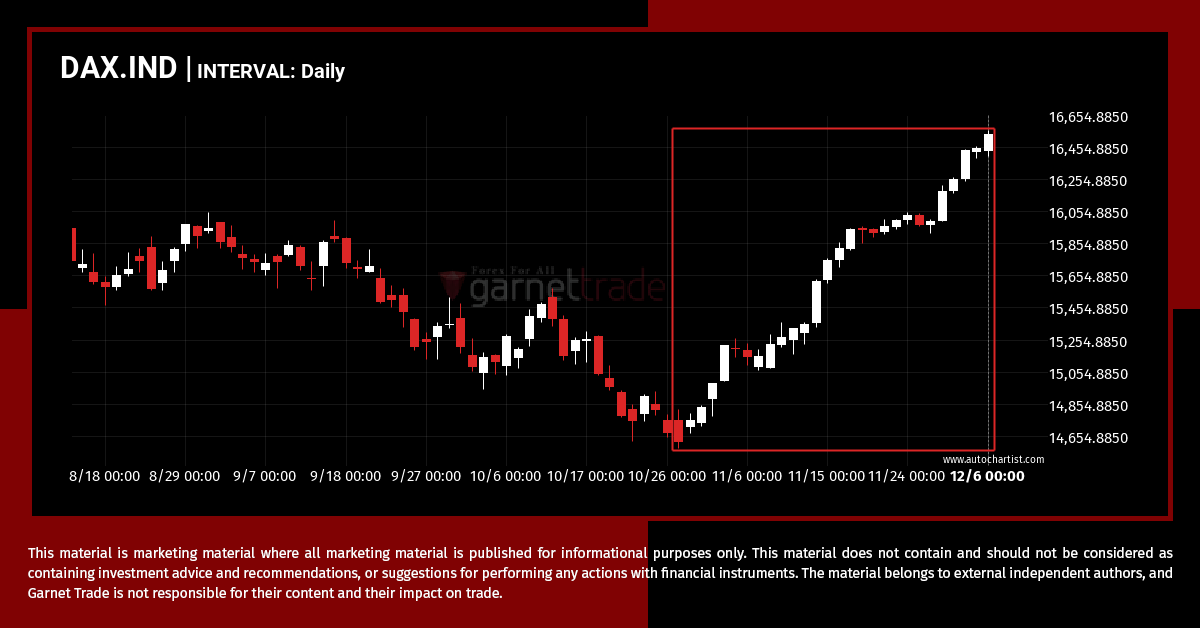
DAX.IND hits 16533.2 after a 13.1% move spanning 41 days.
Possible breach of support level by AUDUSD
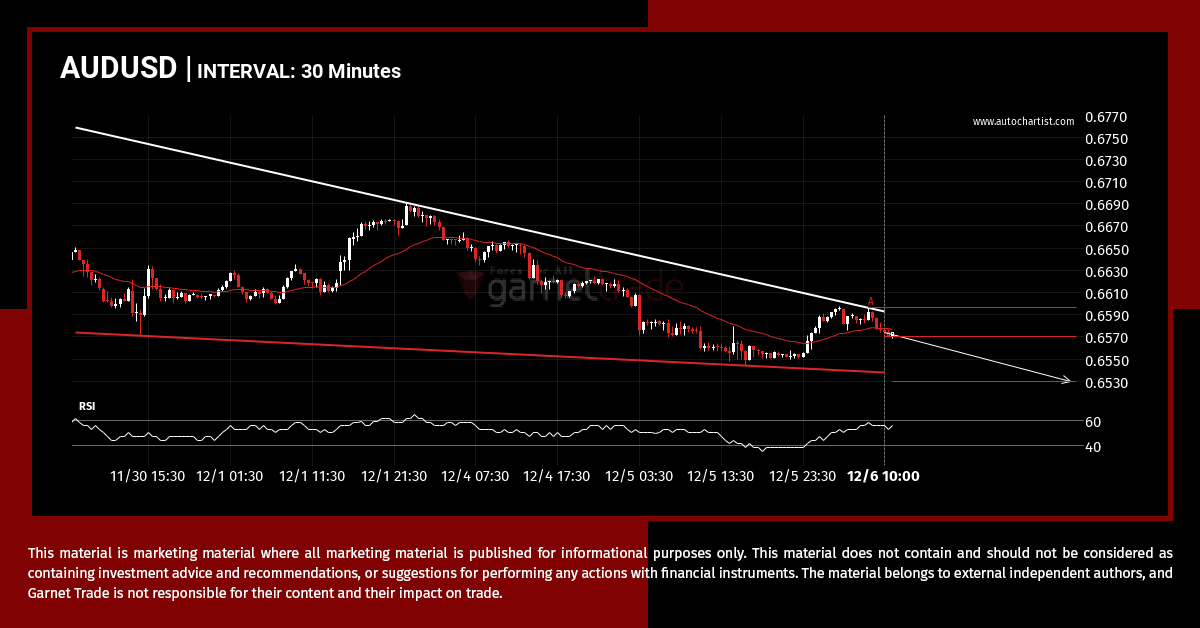
A Falling Wedge pattern was identified on AUDUSD at 0.65707, creating an expectation that it may move to the support line at 0.6530. It may break through that line and continue the bearish trend or it may reverse from that line.
NDX.IND short term bullish trade setup to 16060.8496
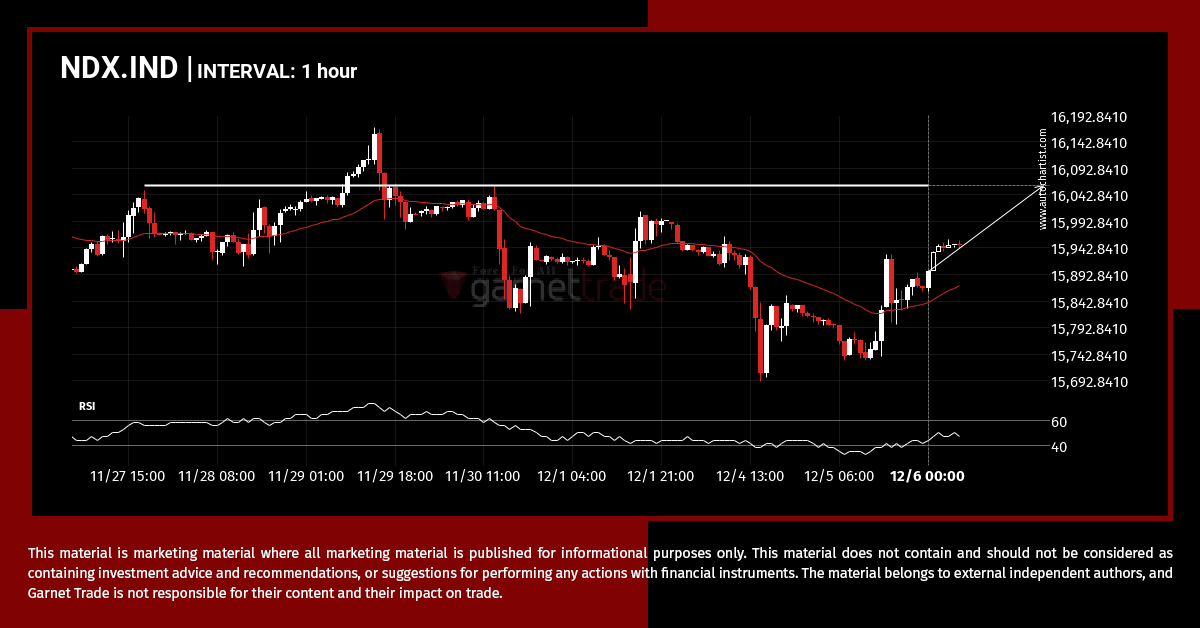
NDX.IND is moving towards a line of 16060.8496 which it has tested numerous times in the past. We have seen it retrace from this position in the past, so at this stage it isn’t clear whether it will breach this price or rebound as it did before. If NDX.IND continues in its current trajectory, we […]
Where is EURGBP moving to?
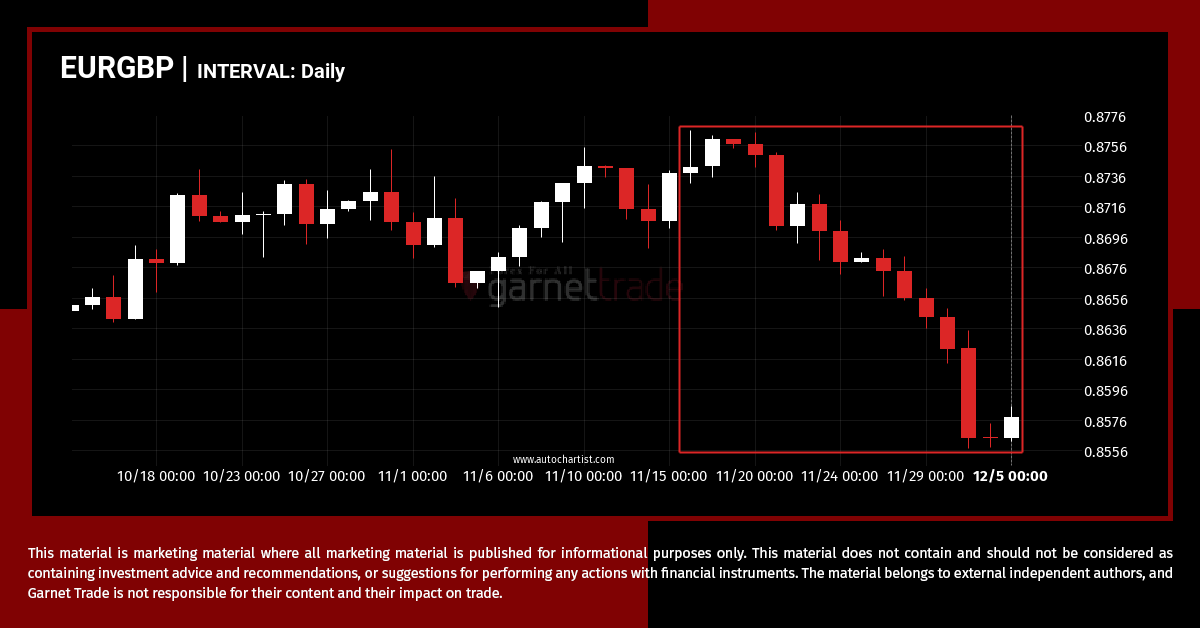
A movement of 1.87% over 20 days on EURGBP doesn’t go unnoticed. You may start considering where it’s heading next, a continuation of the current downward trend, or a reversal in the previous direction.
SPX.IND is on the approach
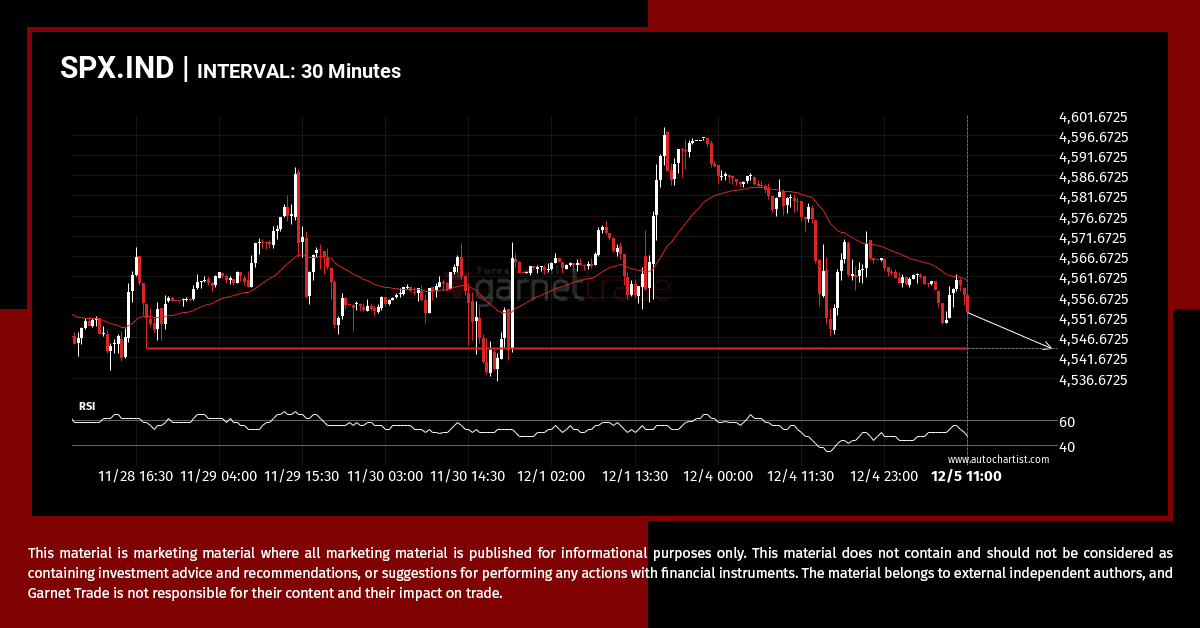
SPX.IND is about to retest a key horizontal support level near 4543.9399. It has tested this level 4 times in the recent past and could simply bounce off like it did last time. However, after this many tries, maybe it’s ready to start a new trend.
EURUSD breakout through resistance
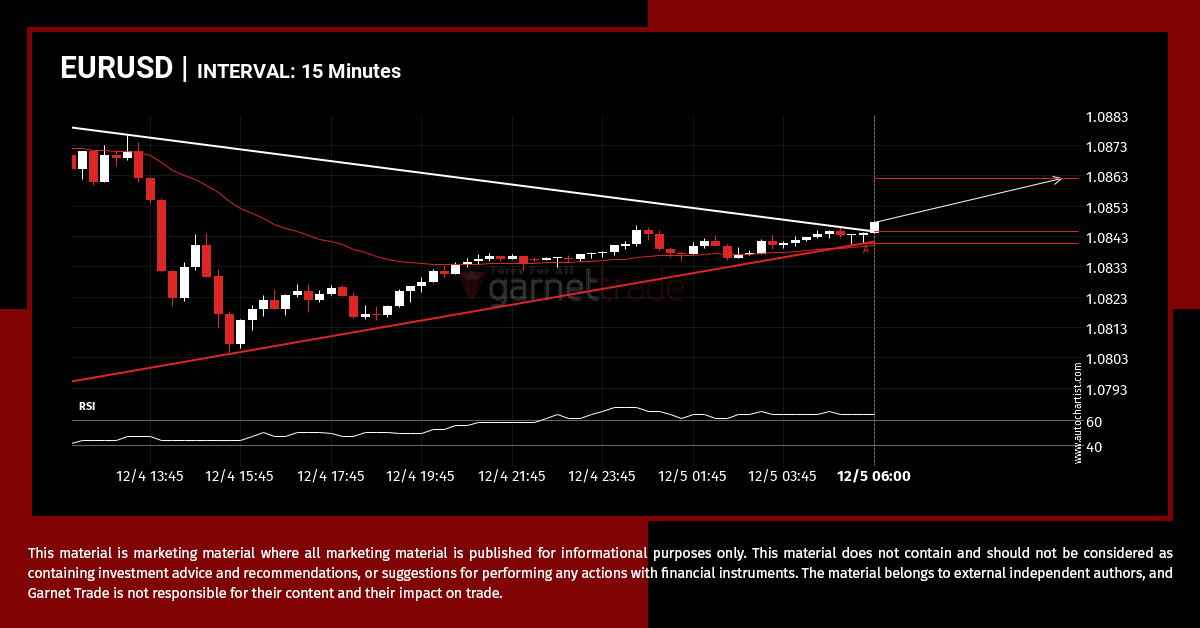
This trade steup on EURUSD is formed by a period of consolidation; a period in which the price primarily moves sideways before choosing a new direction for the longer term. Because of the bullish breakout through resistance, it seems to suggest that we could see the next price move to 1.0862.
Extreme movement on GBPUSD
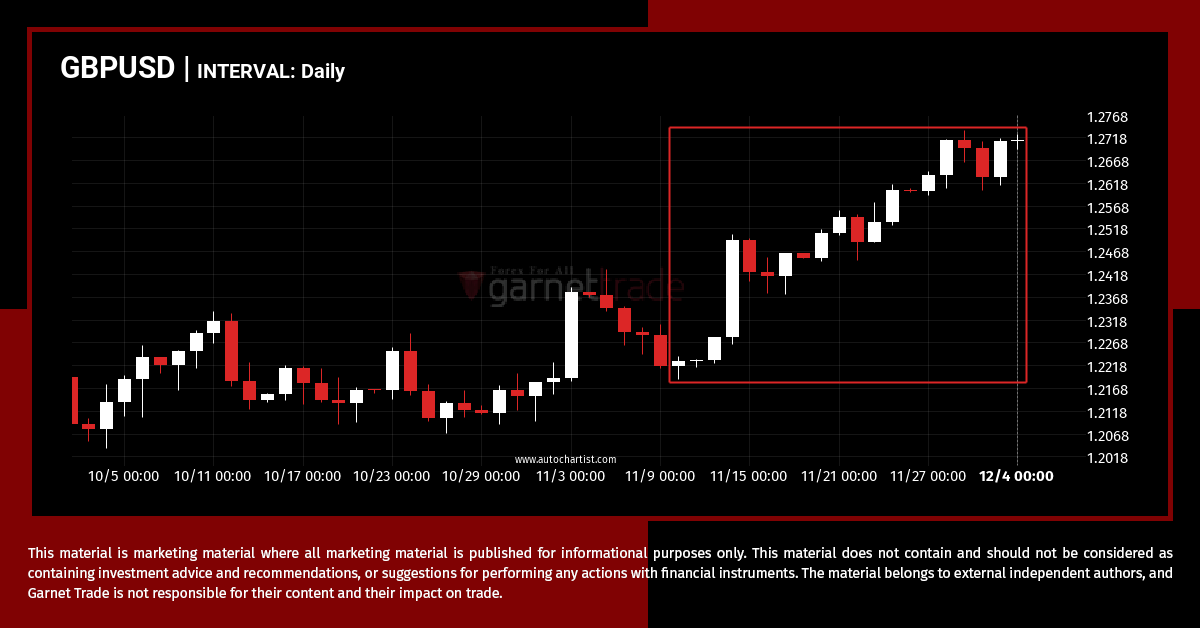
An unexpected large move has occurred on GBPUSD Daily chart beginning at 1.22273 and ending at 1.27111. Is this a sign of something new? What can we expect in the future?