
EURGBP experienced an exceptionally large movement
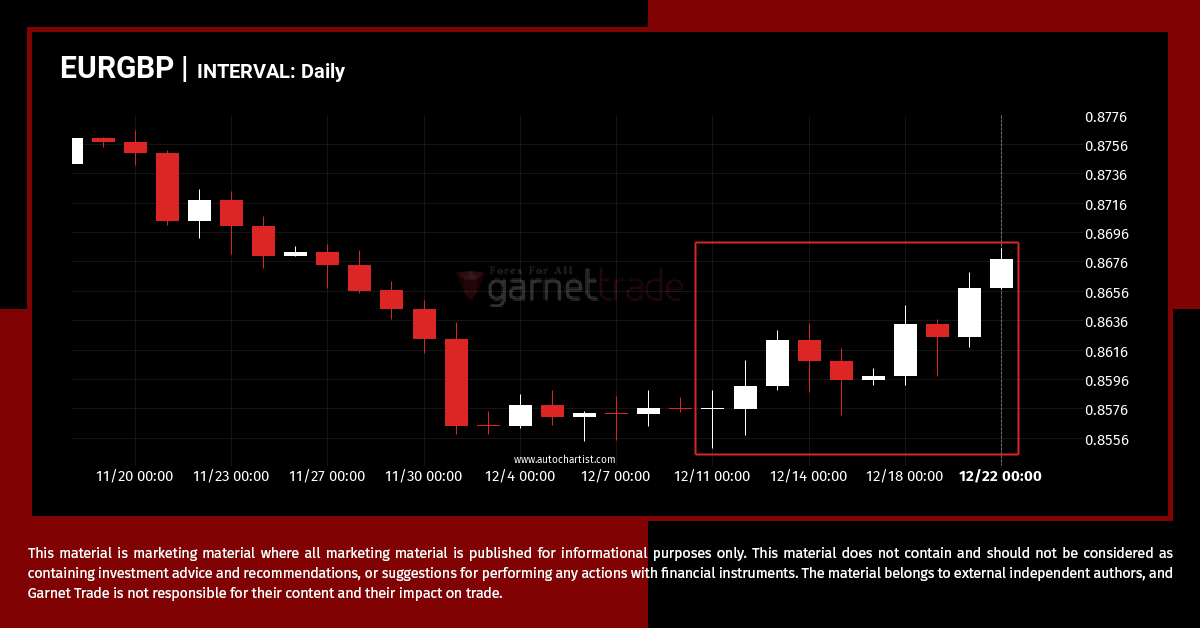
For those of you that don’t believe in trends, this may be an opportunity to take advantage of an exceptional 1.19% move on EURGBP. The movement has happened over the last 12 days. For those trend followers among you, you may think about riding this possible trend.
XAGUSD – psychological price line breached
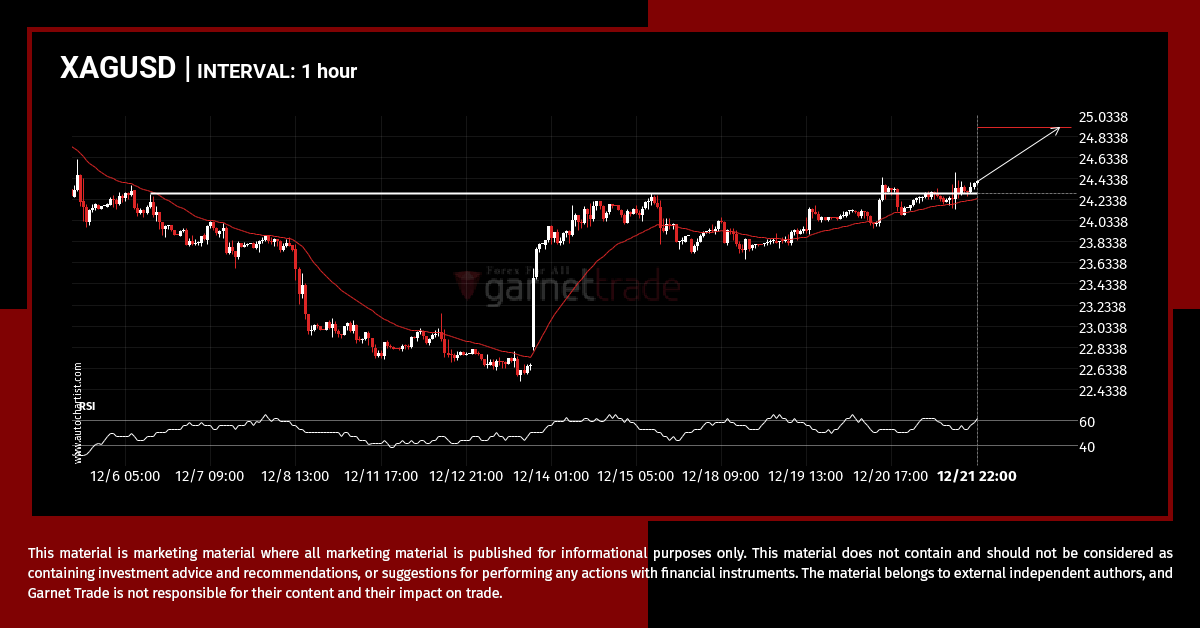
XAGUSD has broken through 24.2940 which it has tested numerous times in the past. We have seen it retrace from this price in the past. If this new trend persists, XAGUSD may be heading towards 24.9137 within the next 3 days.
USDTRY – support line breached
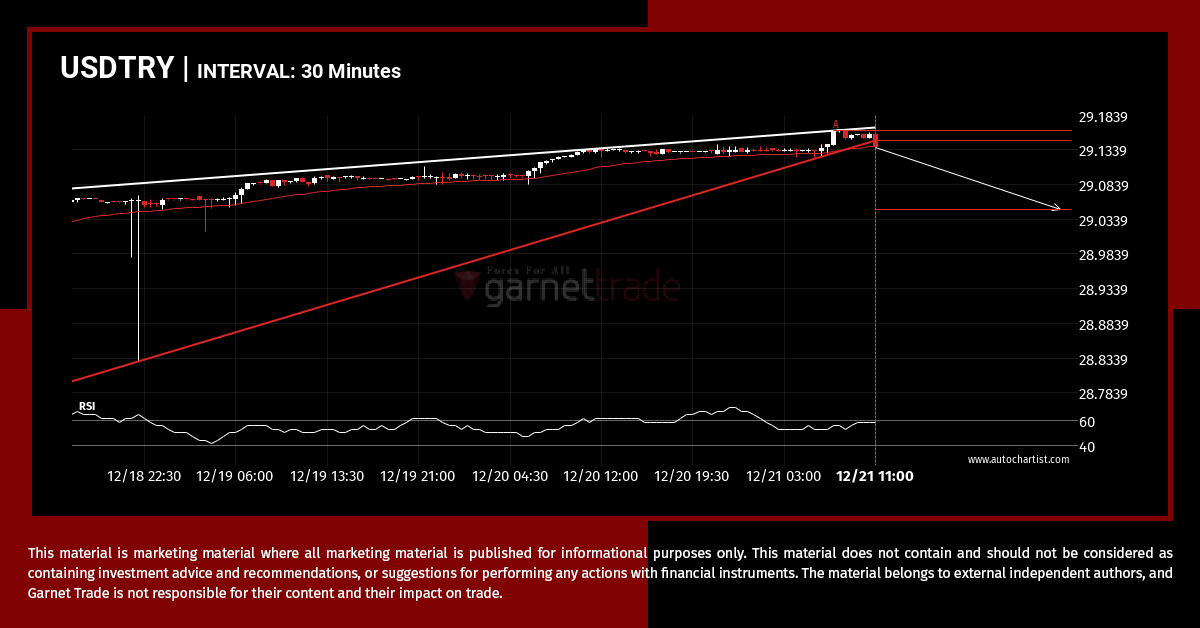
USDTRY has broken through the support line of a Rising Wedge technical chart pattern. Because we have seen it retrace from this line in the past, one should wait for confirmation of the breakout before taking any action. It has touched this line twice in the last 3 days and suggests a possible target level […]
AUDUSD – getting close to psychological price line
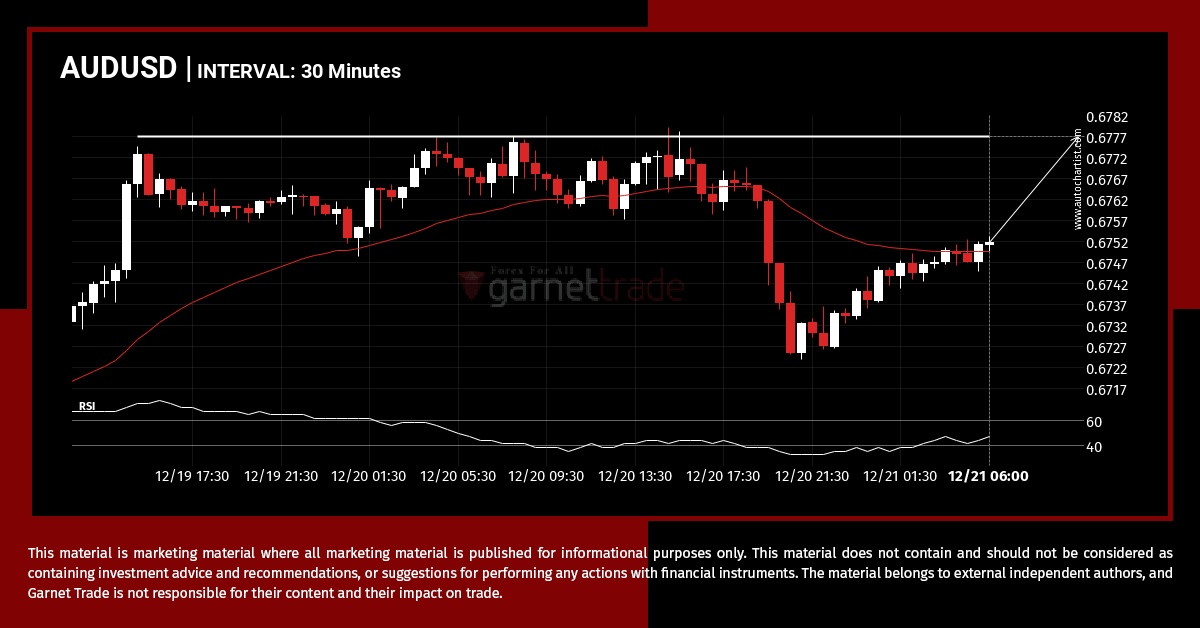
AUDUSD is moving towards a resistance line. Because we have seen it retrace from this level in the past, we could see either a break through this line, or a rebound back to current levels. It has touched this line numerous times in the last 2 days and may test it again within the next […]
GBPUSD – support line broken at 2023-12-20T06:00:00.000Z
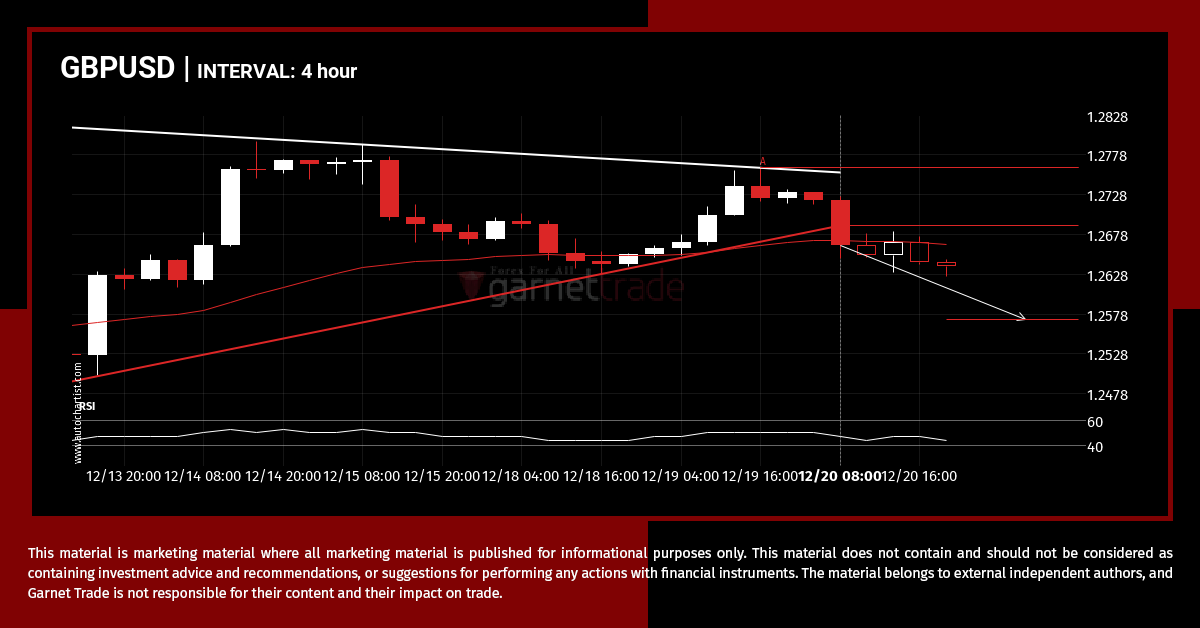
The last 10 4 hour candles on GBPUSD formed a Triangle pattern and broken out through the pattern lines, indicating a possible bearish movement towards the price level of 1.2571.
EURGBP breakout through resistance
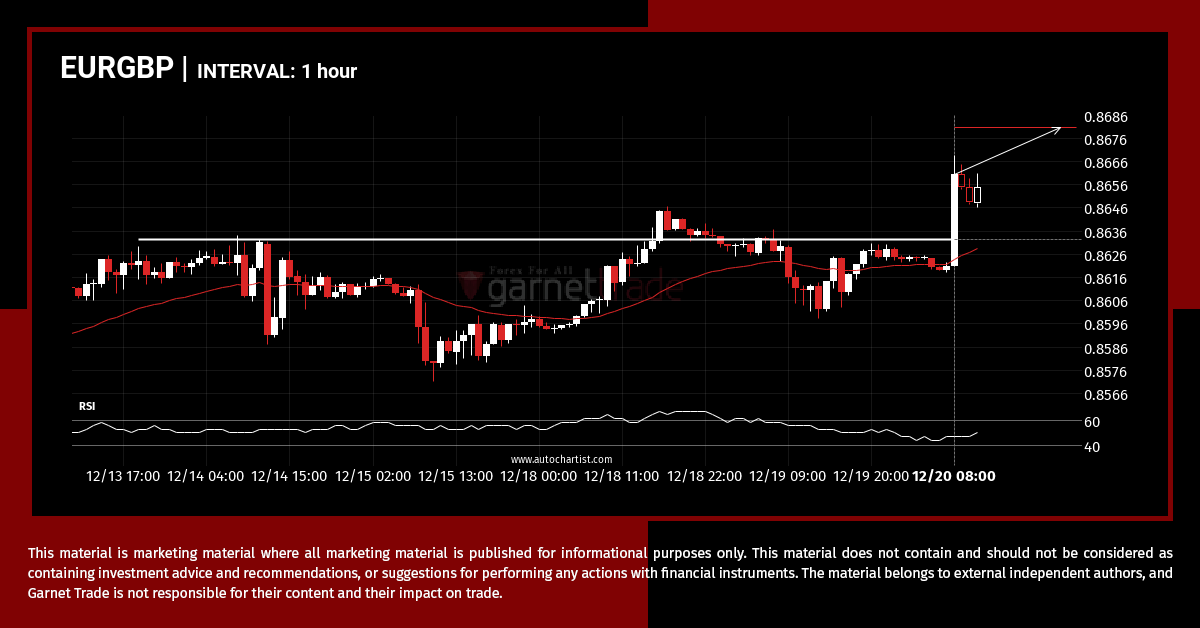
The price of EURGBP in heading in the direction of 0.8681. Despite the recent breakout through 0.8632 it is possible that it will struggle to gain momentum to the forecast price and move back in the other direction. This has happened many times in the past so watch for a possible bounce back.
USDCAD – Continuation Chart Pattern – Channel Down
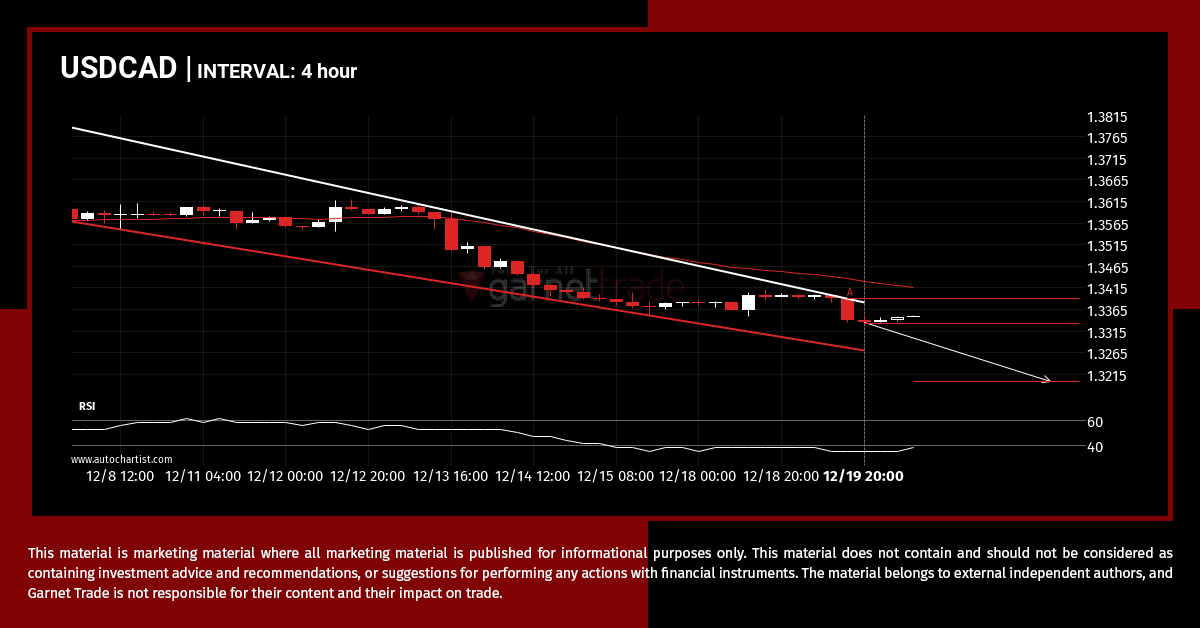
USDCAD is moving towards a support line. Because we have seen it retrace from this line before, we could see either a break through this line, or a rebound back to current levels. It has touched this line numerous times in the last 13 days and may test it again within the next 2 days.
XAUUSD – getting close to support of a Head and Shoulders
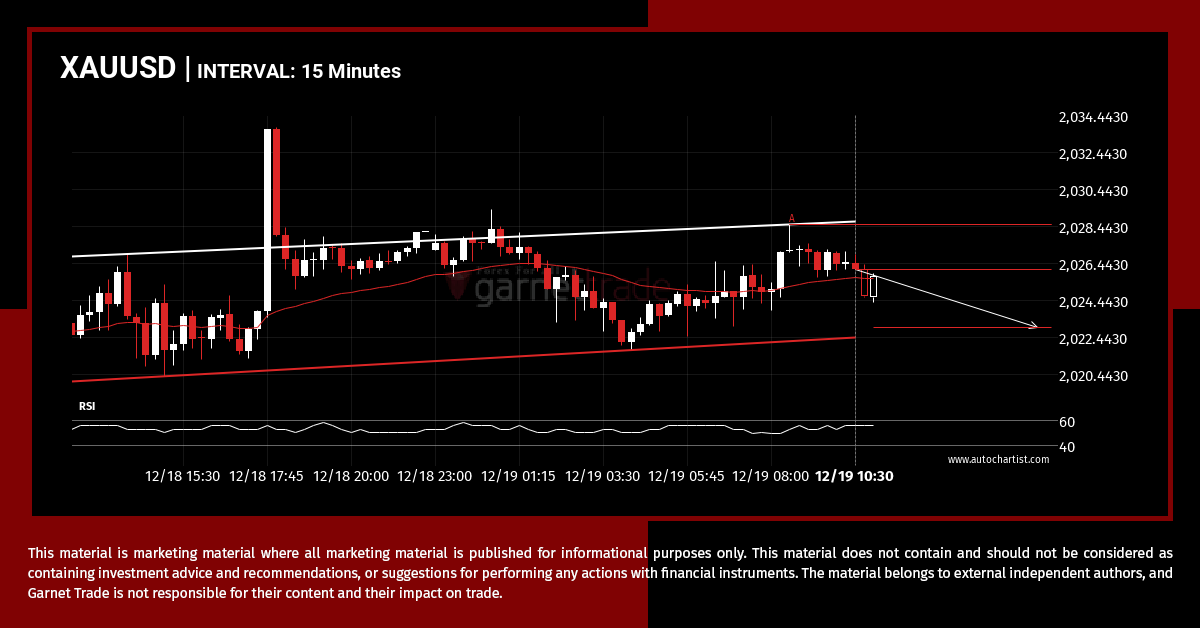
Emerging Head and Shoulders pattern in its final wave was identified on the XAUUSD 15 Minutes chart. After a strong bearish run, we find XAUUSD heading towards the upper triangle line with a possible resistance at 2022.9980. If the support shows to hold, the Head and Shoulders pattern suggests a rebound back towards current levels.
Confirmed breakout on USDCHF 15 Minutes chart
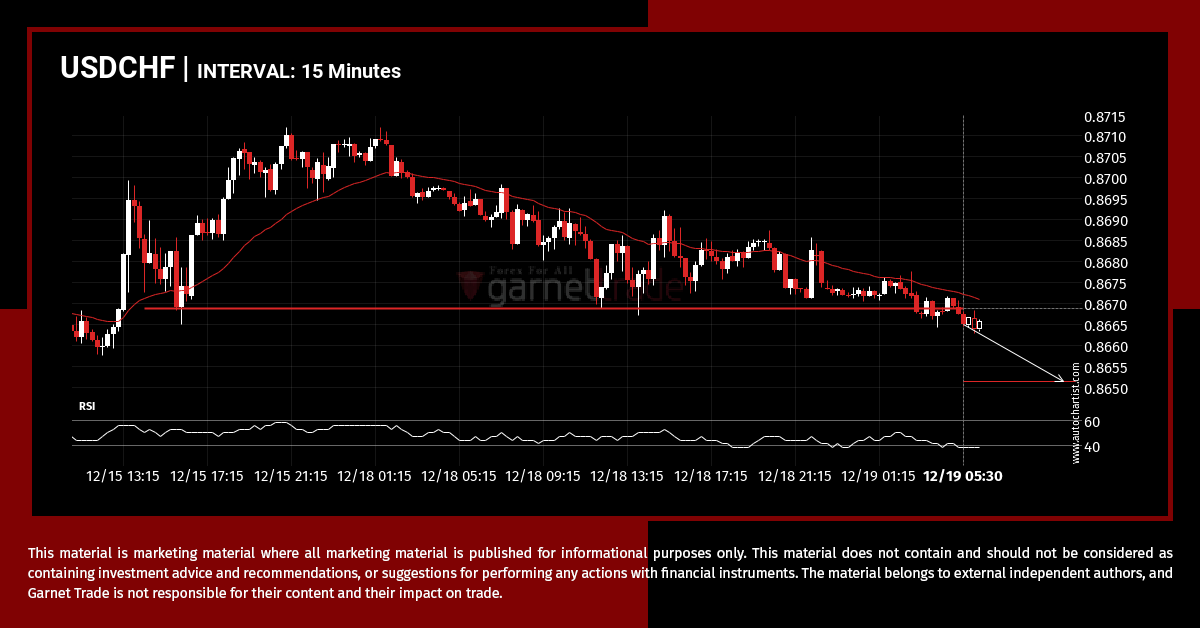
USDCHF has breached the support line at 0.8668. It may conitnue the bearish trend towards 0.8651, or, it may prove to be yet another test of this level.
bullish technical pattern on EURUSD 1 hour
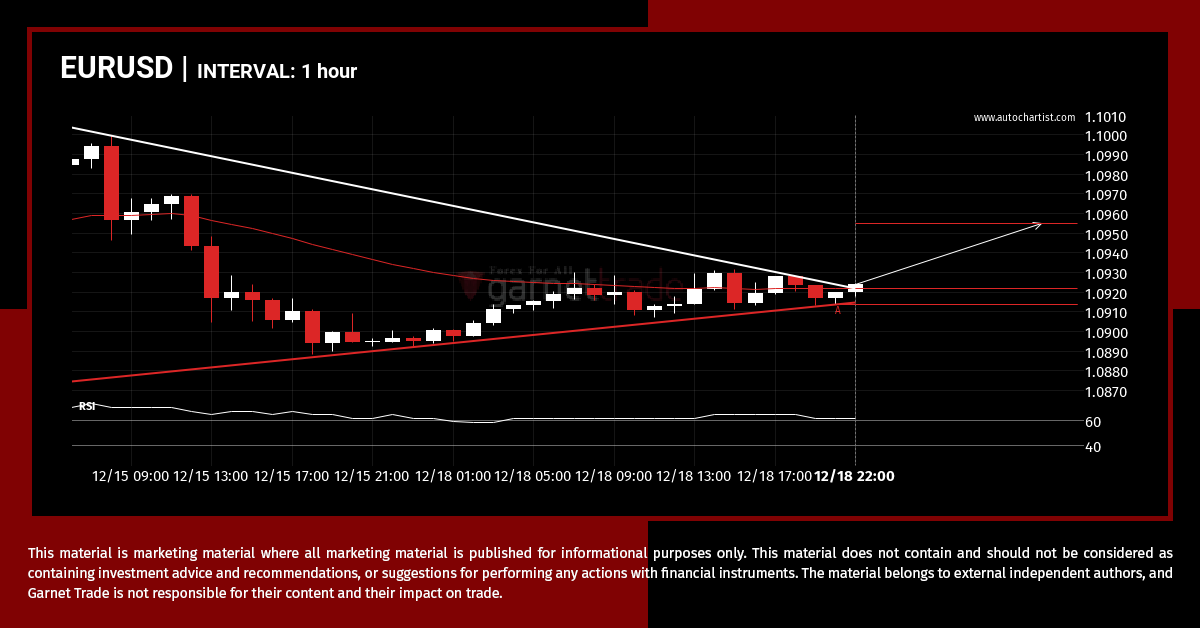
EURUSD has broken through a resistance line of a Triangle and suggests a possible movement to 1.0955 within the next 11 hours. It has tested this line in the past, so one should probably wait for a confirmation of this breakout before taking action. If the breakout doesn’t confirm, we could see a retracement back […]