
Where is EURGBP moving to?
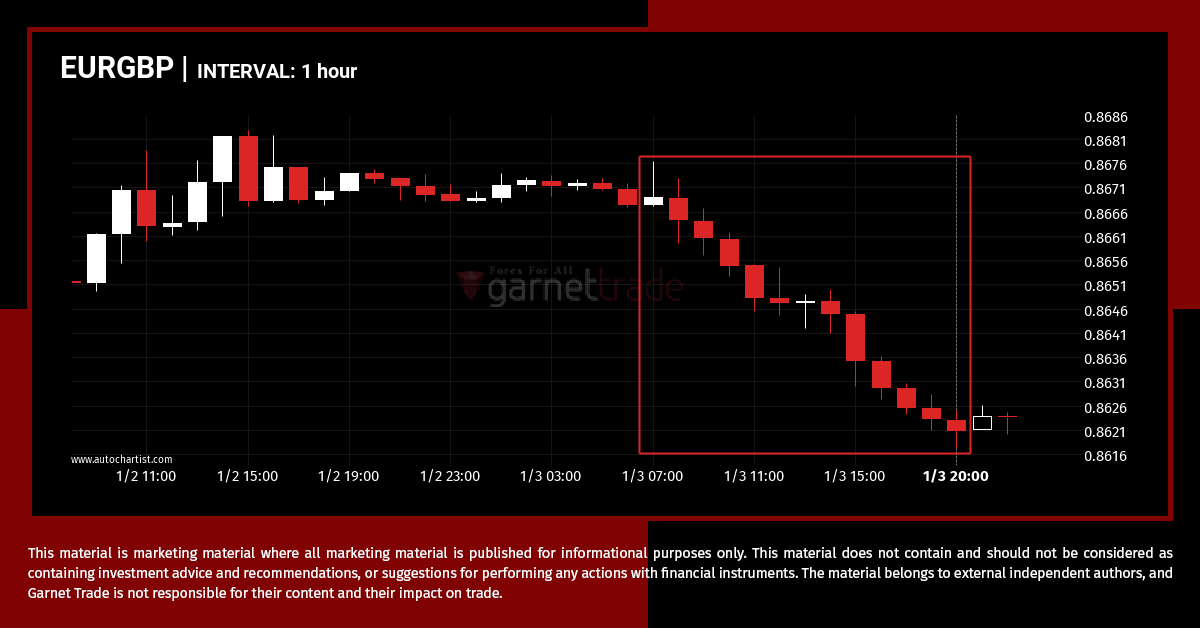
A movement of 0.56% over 13 hours on EURGBP doesn’t go unnoticed. You may start considering where it’s heading next, a continuation of the current downward trend, or a reversal in the previous direction.
XAUUSD breakout through support
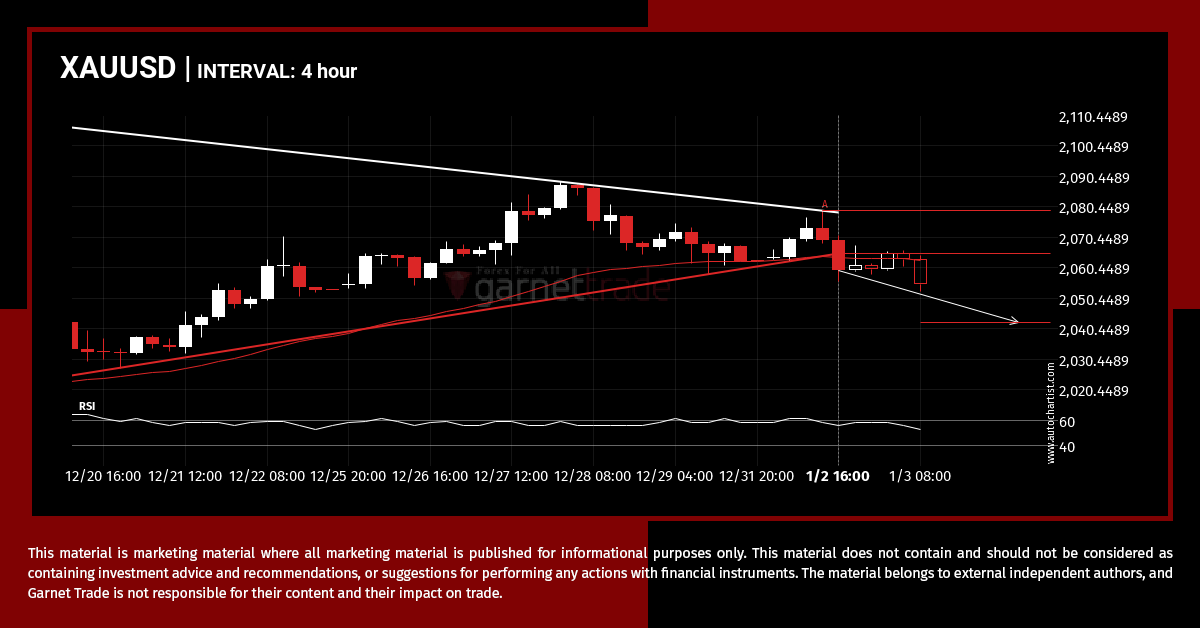
This trade steup on XAUUSD is formed by a period of consolidation; a period in which the price primarily moves sideways before choosing a new direction for the longer term. Because of the bearish breakout through support, it seems to suggest that we could see the next price move to 2042.3309.
UKX.IND approaches important level of 7672.8999
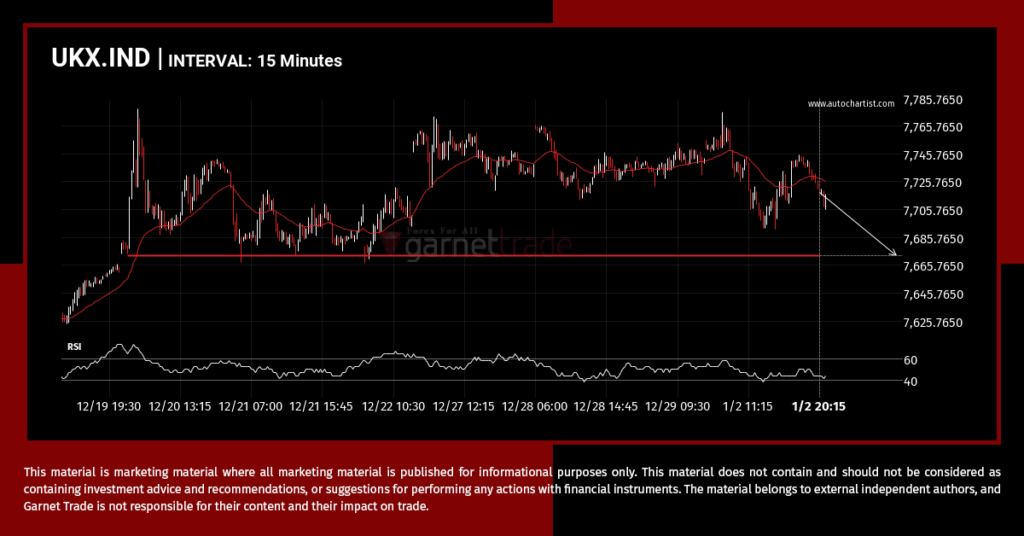
UKX.IND is about to retest a key horizontal support level near 7672.8999. It has tested this level 4 times in the recent past and could simply bounce off like it did last time. However, after this many tries, maybe it’s ready to start a new trend.
EURUSD experienced an exceptionally large movement
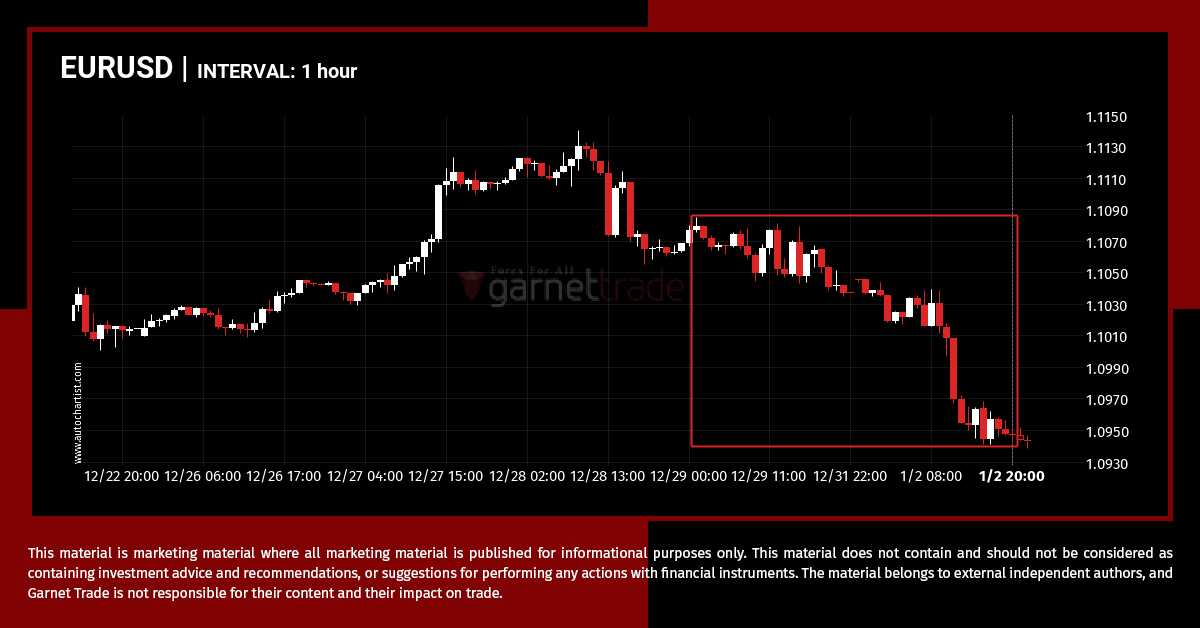
EURUSD has experiened an extremely big movement in last 5 days. It may continue the trend, but this would make the move unprecidented in the recent past.
A potential bearish movement on AUDUSD
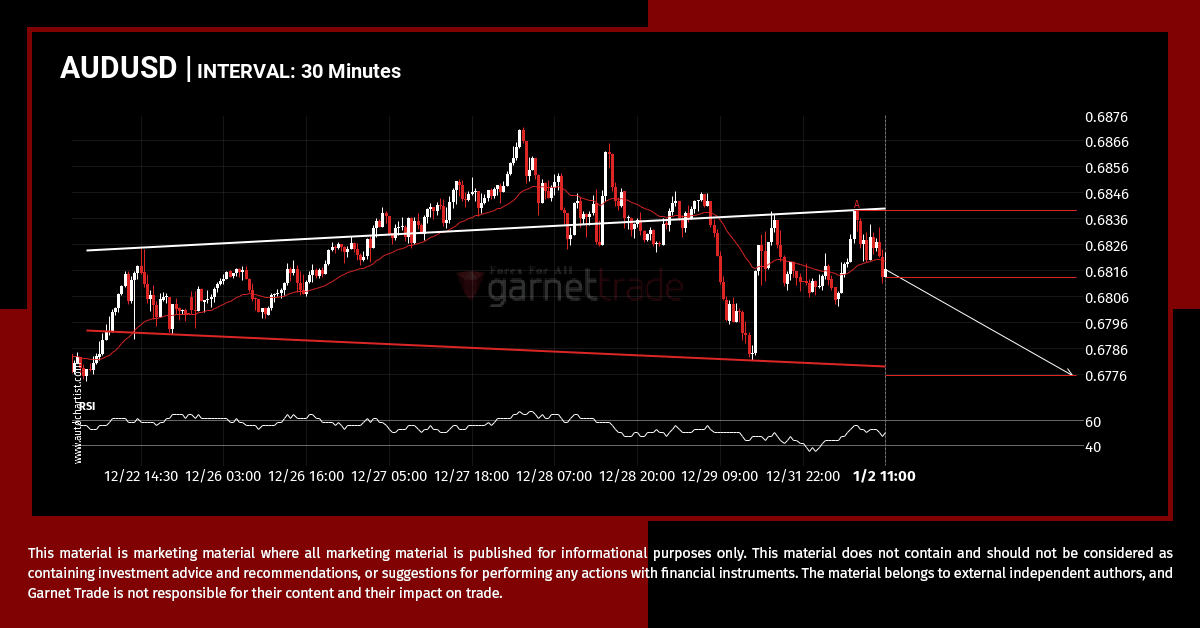
AUDUSD is heading towards the support line of a Head and Shoulders and could reach this point within the next 2 days. It has tested this line numerous times in the past, and this time could be no different from the past, ending in a rebound instead of a breakout. If the breakout doesn’t happen, […]
Resistance breakout on DAX.IND
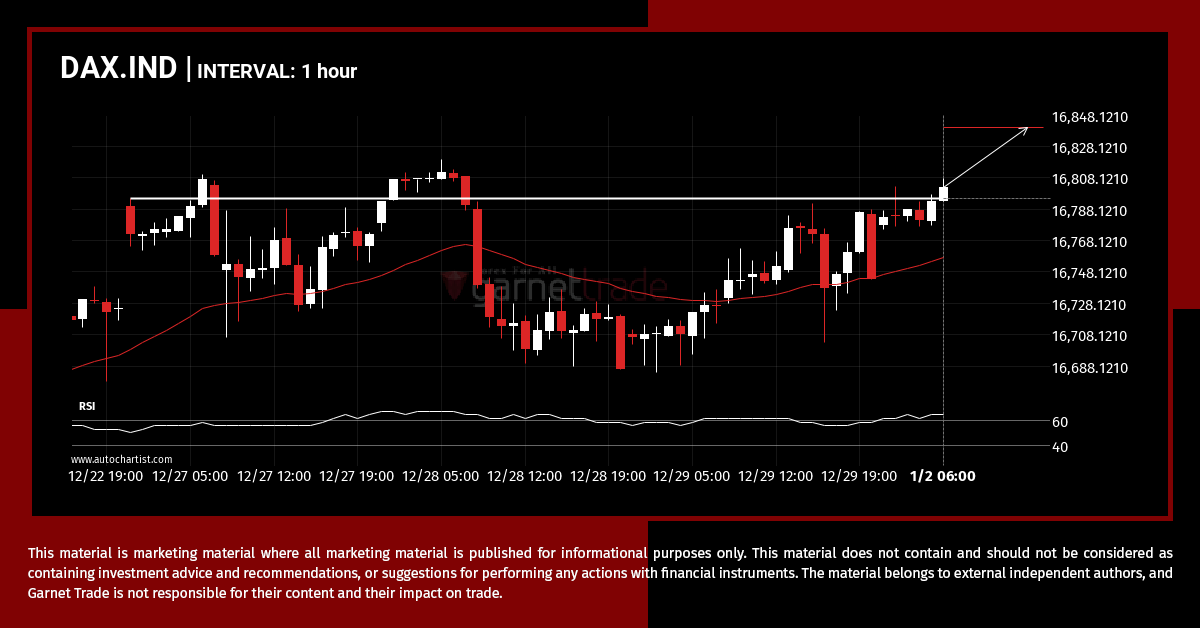
DAX.IND has broken through 16794.9004 which it has tested numerous times in the past. We have seen it retrace from this price in the past. If this new trend persists, DAX.IND may be heading towards 16840.0391 within the next 16 hours.
A potential bearish movement on GBPUSD
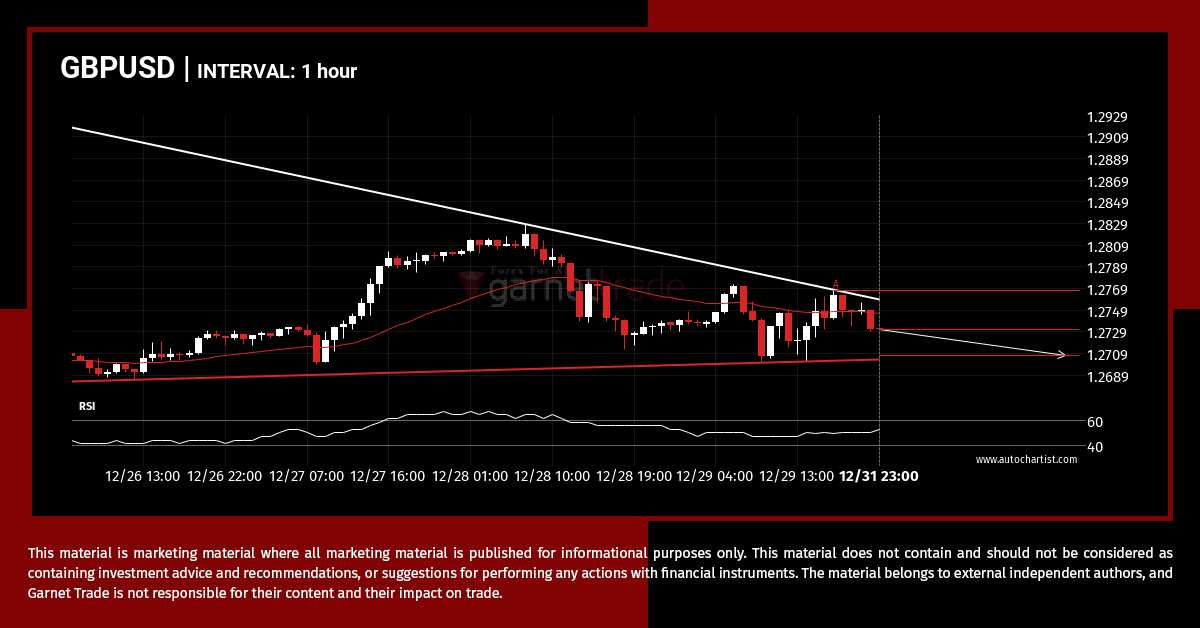
GBPUSD is approaching the support line of a Triangle. It has touched this line numerous times in the last 10 days. If it tests this line again, it should do so in the next 2 days.
Did you miss this move on USDCHF?
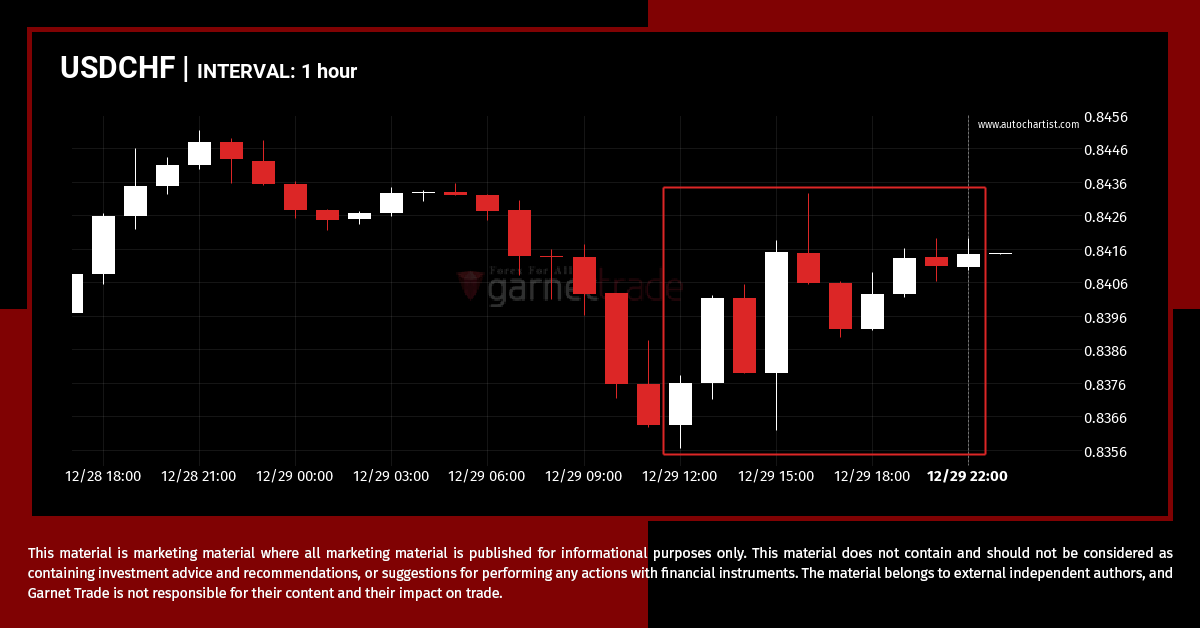
For those of you that don’t believe in trends, this may be an opportunity to take advantage of an exceptional 0.49% move on USDCHF. The movement has happened over the last 10 hours. For those trend followers among you, you may think about riding this possible trend.
UKX.IND – Reversal Chart Pattern – Ascending Triangle
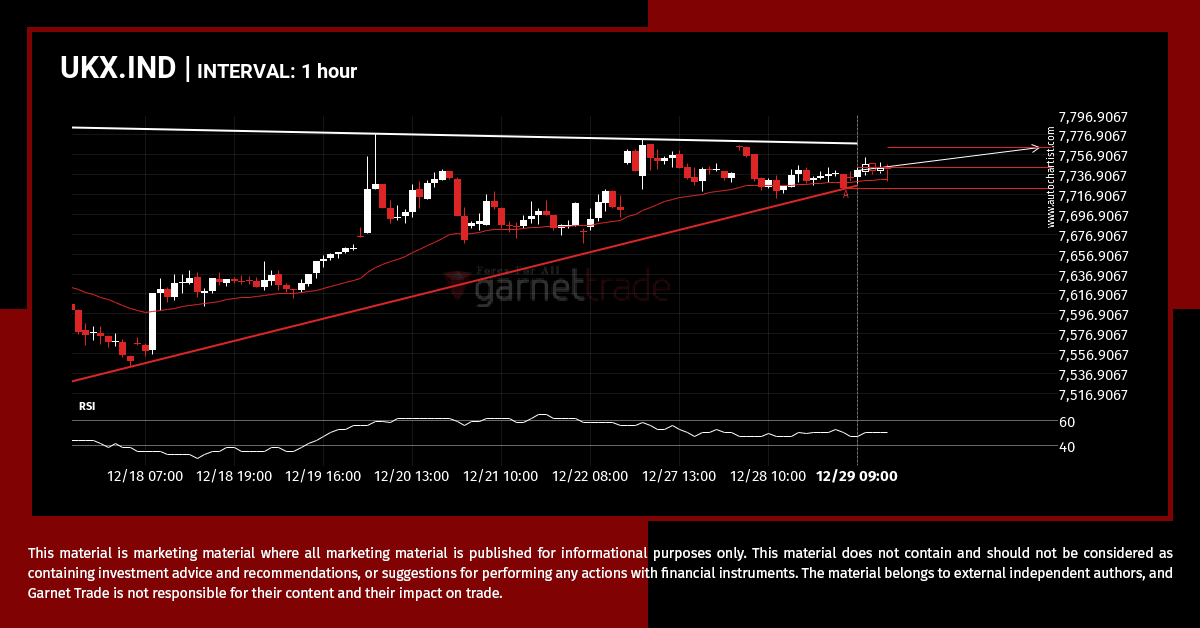
Emerging Ascending Triangle pattern in its final wave was identified on the UKX.IND 1 hour chart. After a strong bullish run, we find UKX.IND heading towards the upper triangle line with a possible resistance at 7764.5750. If the resistance shows to hold, the Ascending Triangle pattern suggests a rebound back towards current levels.
A final push possible on USDCAD
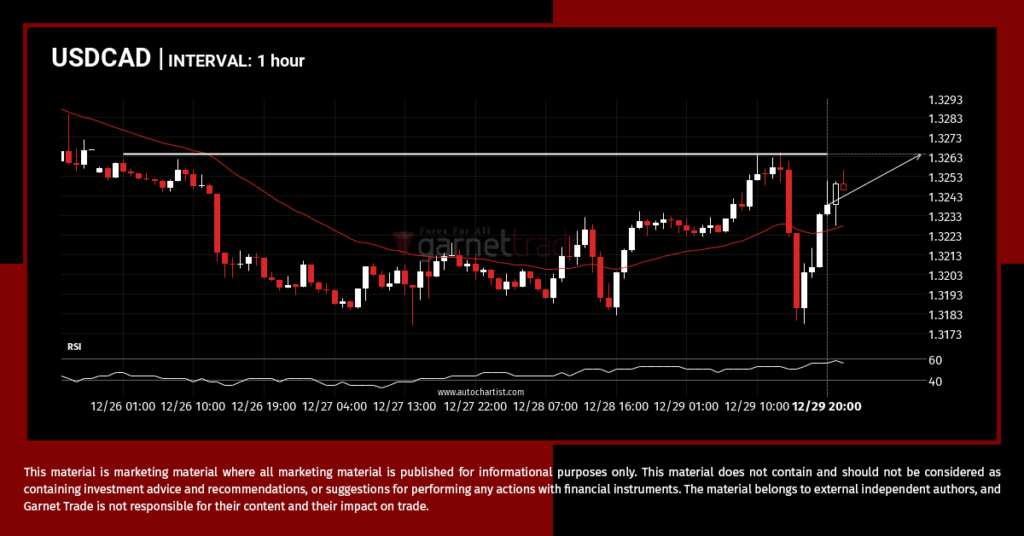
USDCAD is heading towards 1.3265 and could reach this point within the next 20 hours. It has tested this line numerous times in the past, and this time could be no different, ending in a rebound instead of a breakout. If the breakout doesn’t happen, we could see a retracement back down to current levels.