
A 3 days run-downward on EURGBP
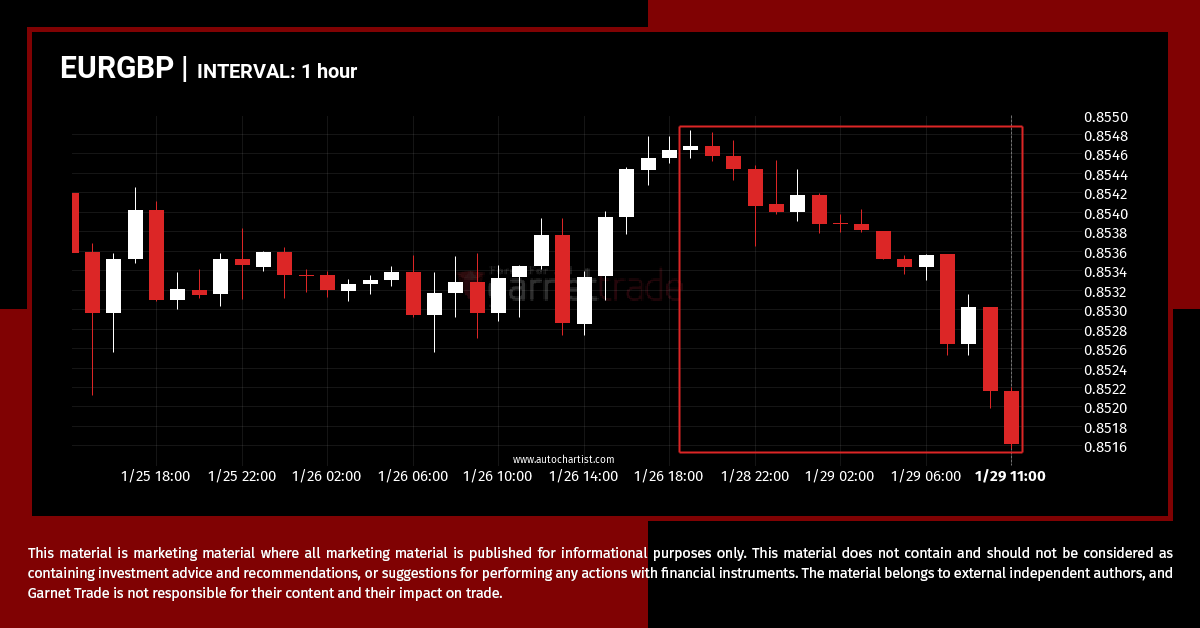
An unexpected large move has occurred on EURGBP 1 hour chart beginning at 0.85465 and ending at 0.85159. Is this a sign of something new? What can we expect in the future?
Possible breach of resistance level by AUDUSD
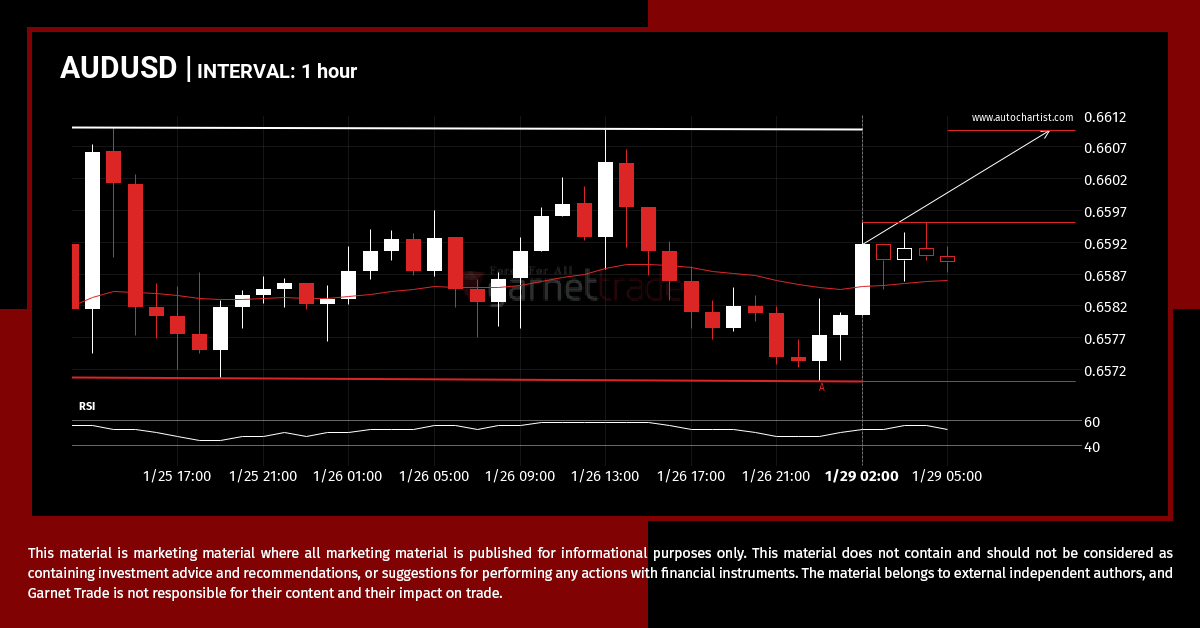
AUDUSD is approaching the resistance line of a Rectangle. It has touched this line numerous times in the last 5 days. If it tests this line again, it should do so in the next 7 hours.
A potential bearish movement on SPX.IND
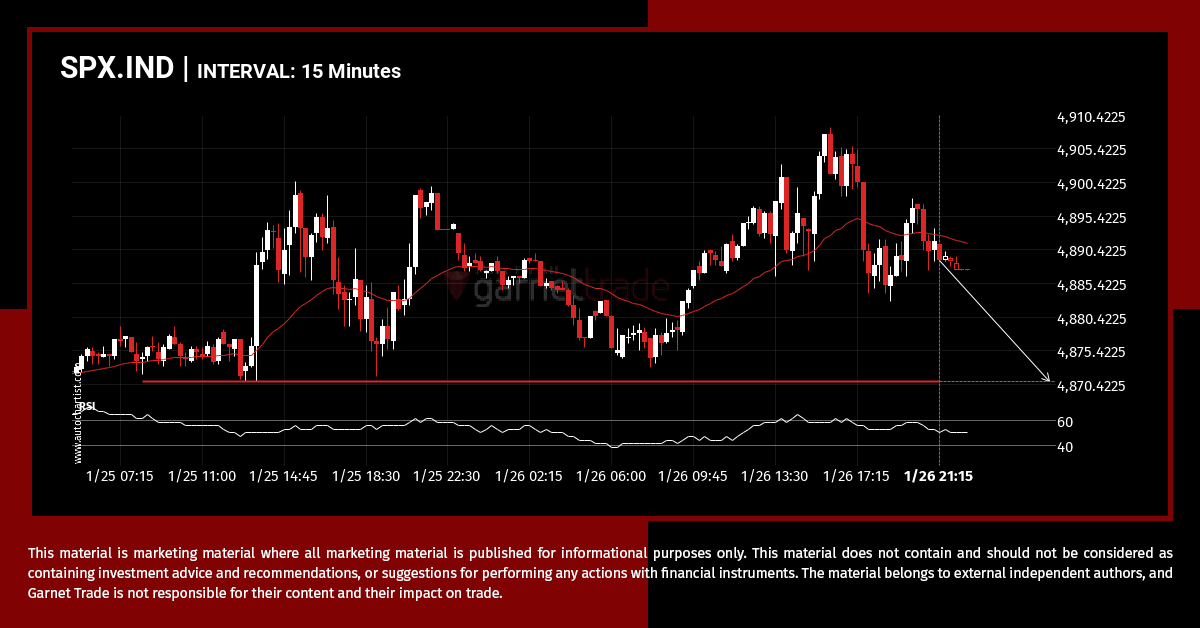
SPX.IND is approaching a support line at 4870.8901. If it hits the support line, it may break through this level to continue the bearish trend, or it may turn around back to current levels.
EURUSD approaches important level of 1.0903
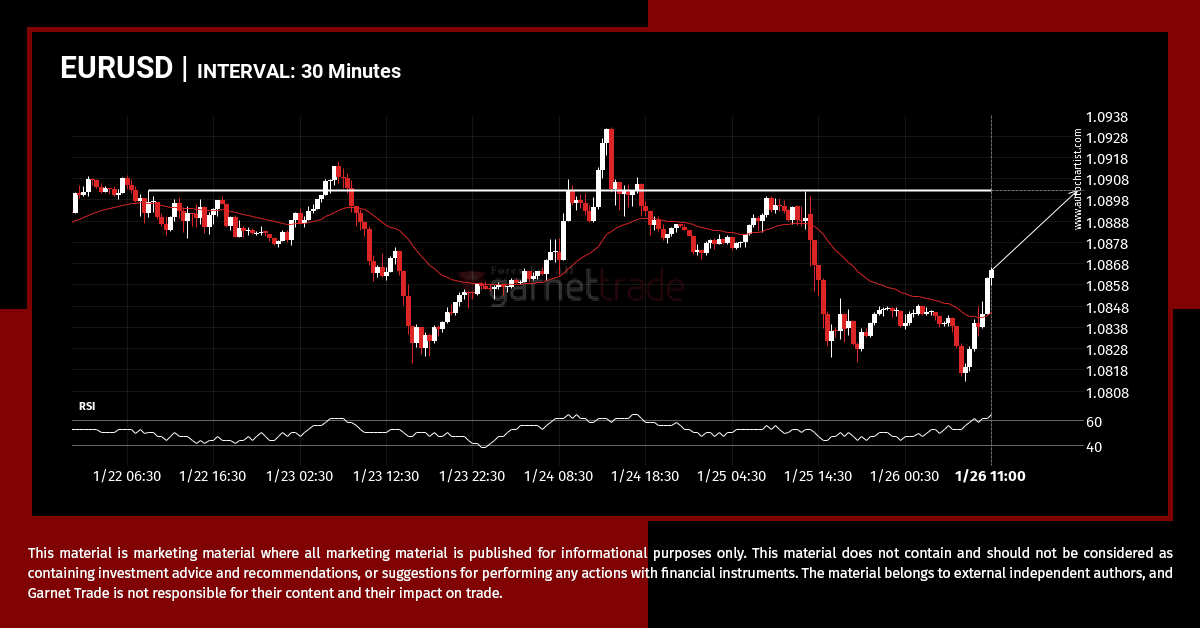
EURUSD is en route to a very important line that will be a definite deciding factor of what is to come! We may see this trajectory continue to touch and break through 1.0903, unless it runs out of momentum and pulls back to current levels.
Either a rebound or a breakout imminent on XAUUSD
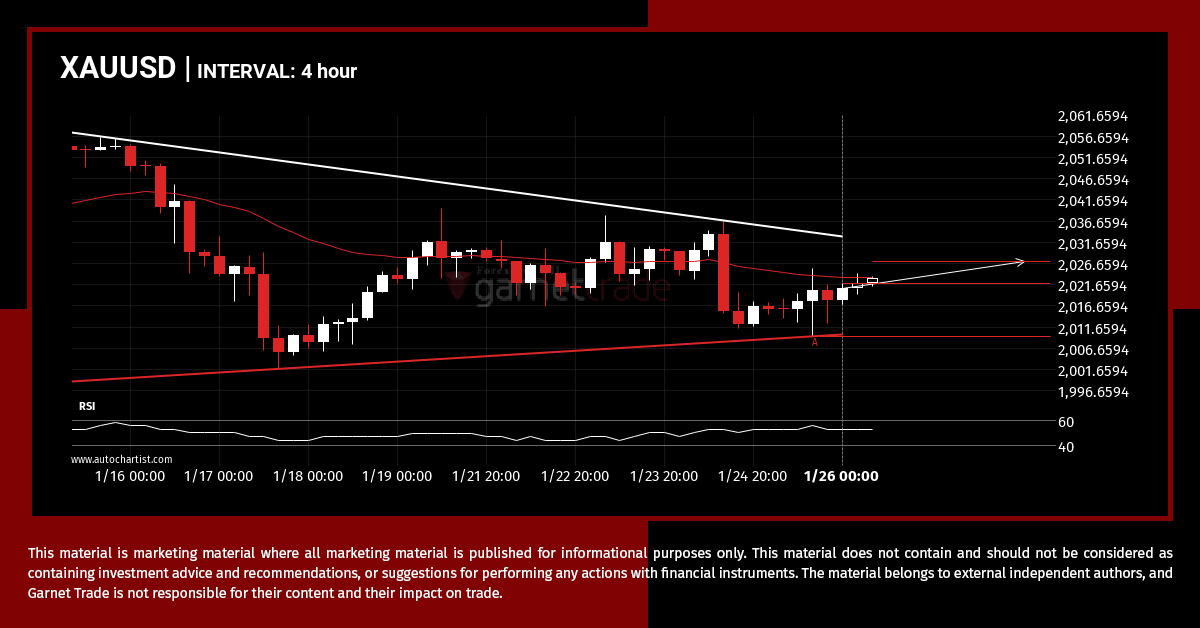
XAUUSD was identified at around 2021.88 having recently rebounded of the support on the 4 hour data interval. Ultimately, the price action of the stock has formed a Triangle pattern. This squeeze may increases the chances of a strong breakout. The projected movement will potentially take the price to around the 2027.1732 level.
USDCAD approaches important level of 1.3424
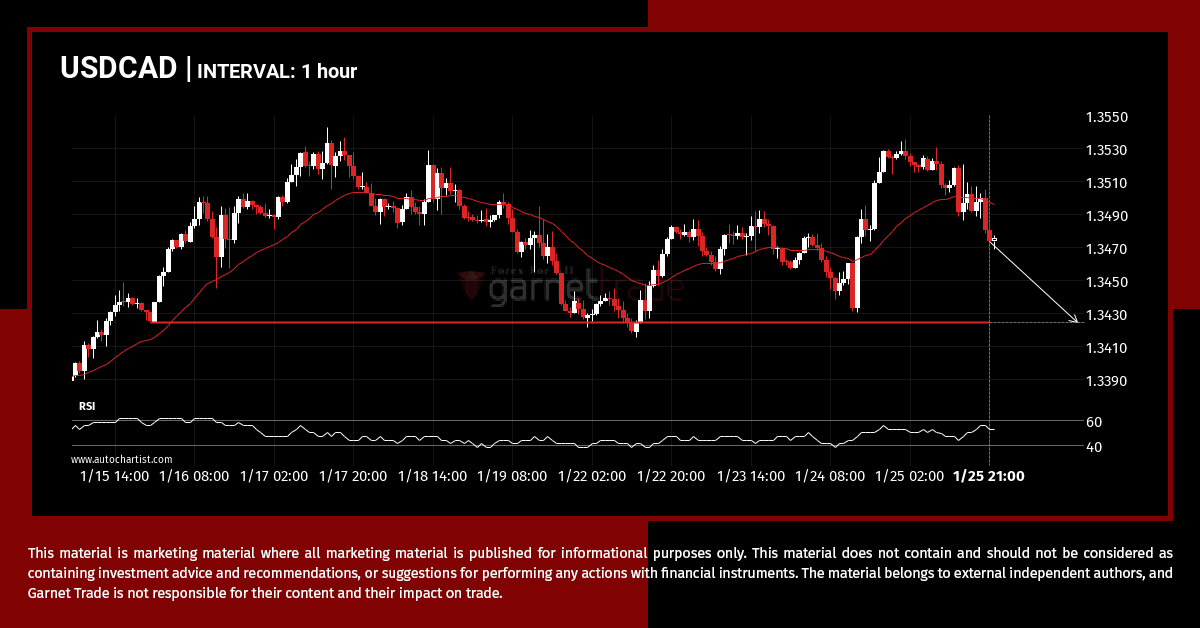
USDCAD is heading towards a line of 1.3424. If this movement continues, the price of USDCAD could test 1.3424 within the next 2 days. But don’t be so quick to trade, it has tested this line numerous times in the past, so this movement could be short-lived and end up rebounding.
A 27 days run-upward on USDCHF
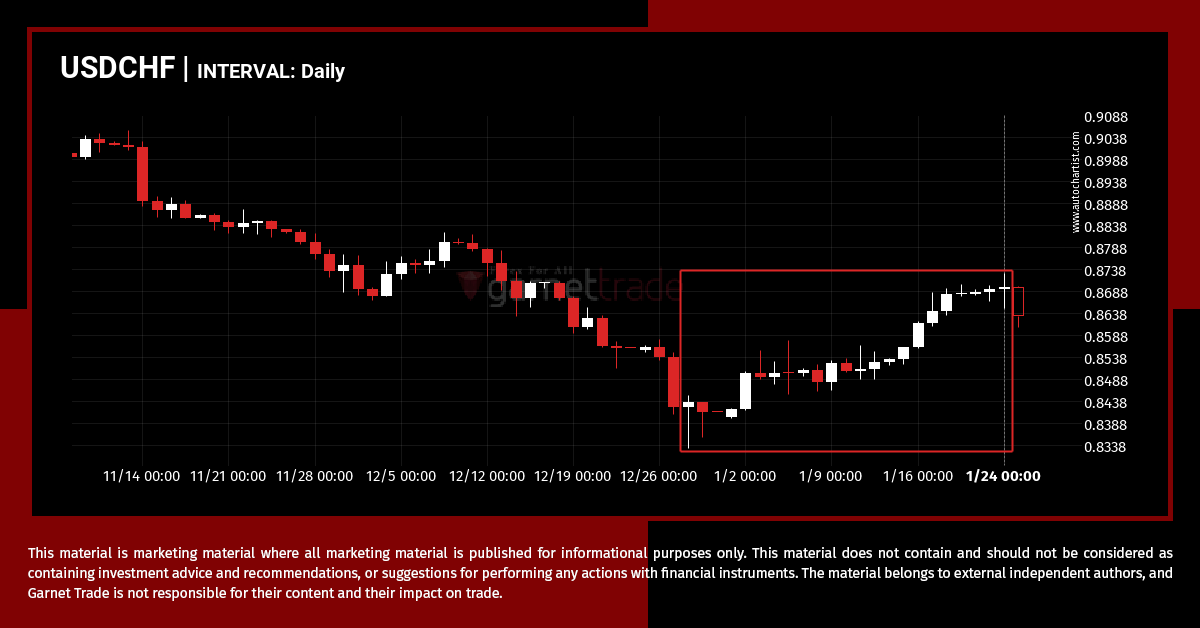
USDCHF rose sharply for 27 days – which is an excessively big movement for this instrument; exceeding the 98% of past price moves. Even if this move is a sign of a new trend in USDCHF there is a chance that we will witness a correction, no matter how brief.
UKX.IND has broken through support
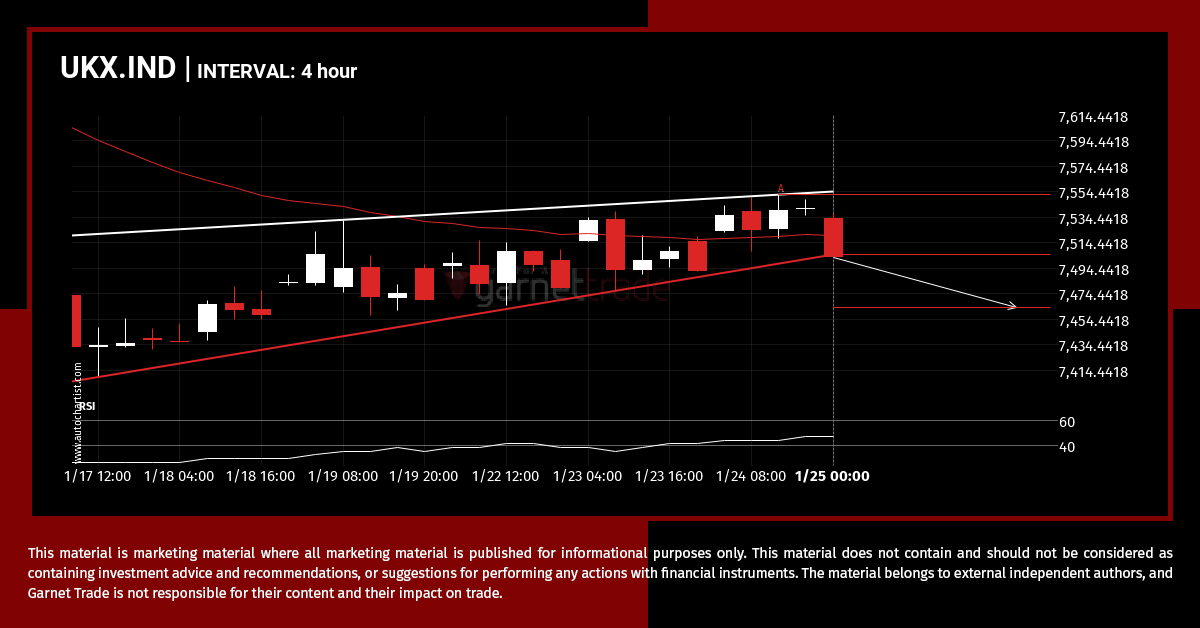
UKX.IND has broken through a support line of a Pennant chart pattern. If this breakout holds true, we may see the price of UKX.IND testing 7463.8608 within the next 2 days. But don’t be so quick to trade, it has tested this line in the past, so you should confirm the breakout before taking any […]
USDCAD – getting close to psychological price line
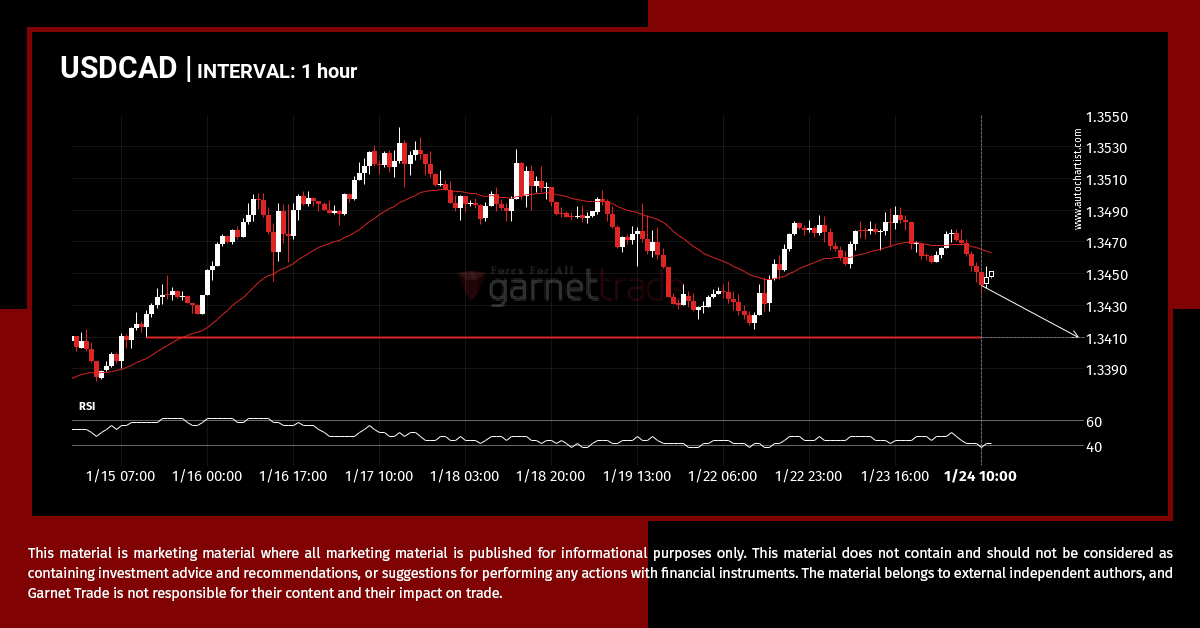
USDCAD is heading towards 1.3410 and could reach this point within the next 2 days. It has tested this line numerous times in the past, and this time could be no different, ending in a rebound instead of a breakout. If the breakout doesn’t happen, we could see a retracement back down to current levels.
Is USDCHF likely to correct after consecutive bullish candles?
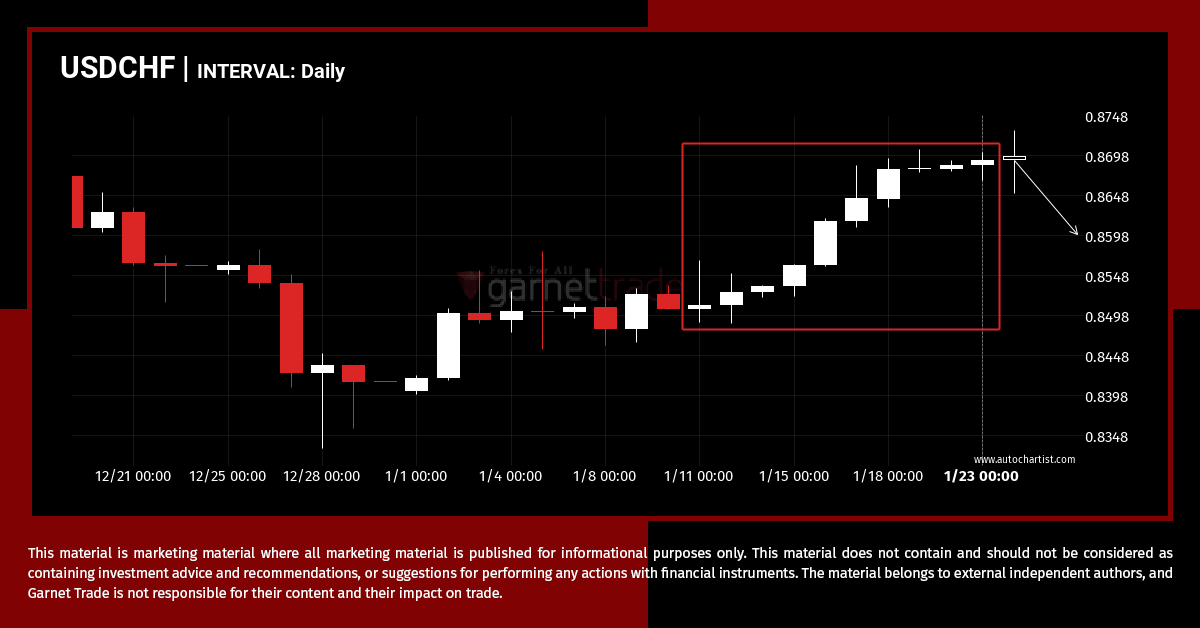
Due to the rate of consecutive bullish candles on USDCHF Daily chart we could be in for a price correction. If not, this trend could be a sign of things to come