
Possible breach of support level by DAX.IND
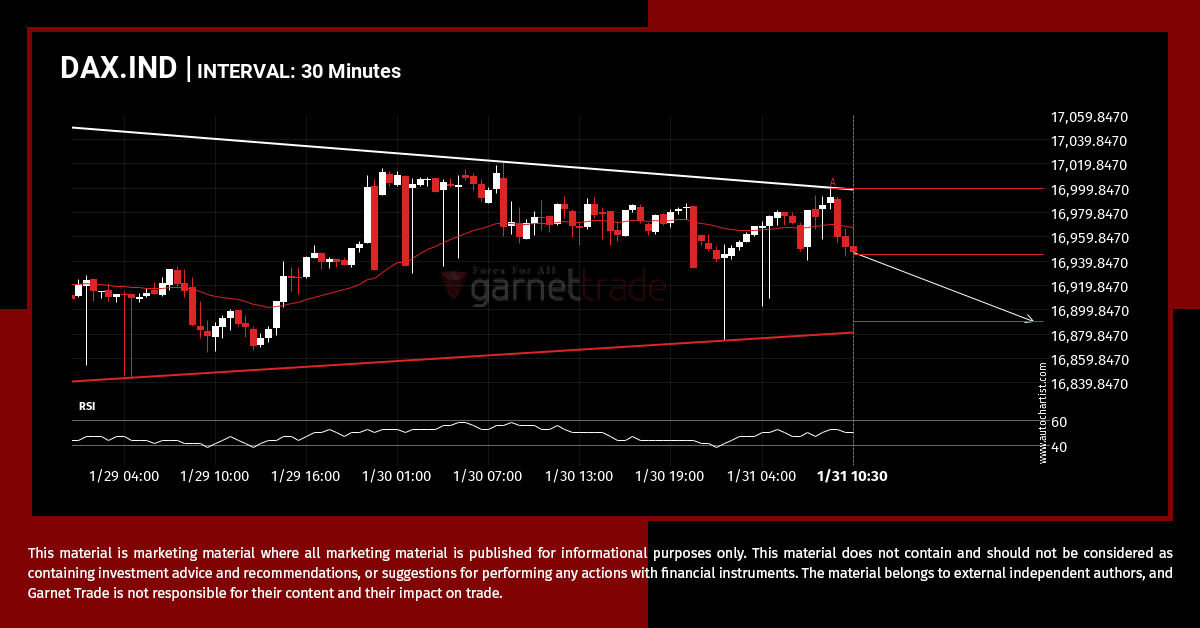
DAX.IND was identified at around 16945.0 having recently rebounded of the resistance on the 30 Minutes data interval. Ultimately, the price action of the stock has formed a Triangle pattern. This squeeze may increases the chances of a strong breakout. The projected movement will potentially take the price to around the 16890.4298 level.
Should we expect a breakout or a rebound on USDCAD?
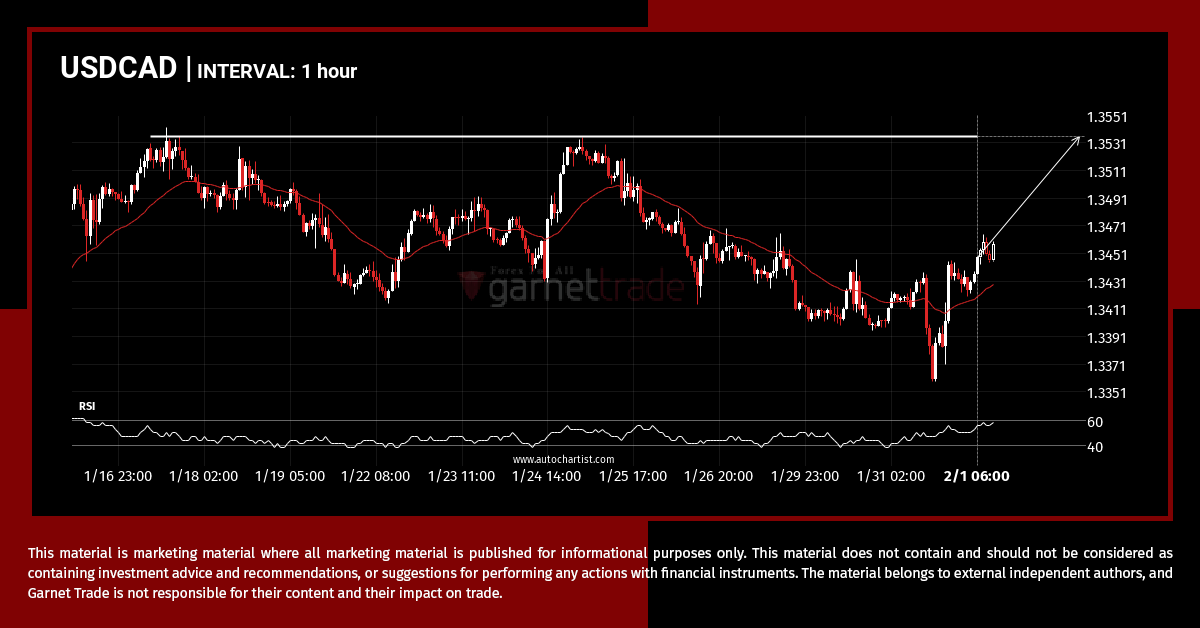
The price of USDCAD in heading back to the resistance area. It is possible that it will struggle to break through it and move back in the other direction. The price may eventually break through, but typically the price retreats from the level a number of times before doing so.
EURGBP – Extreme movement, a rare opportunity
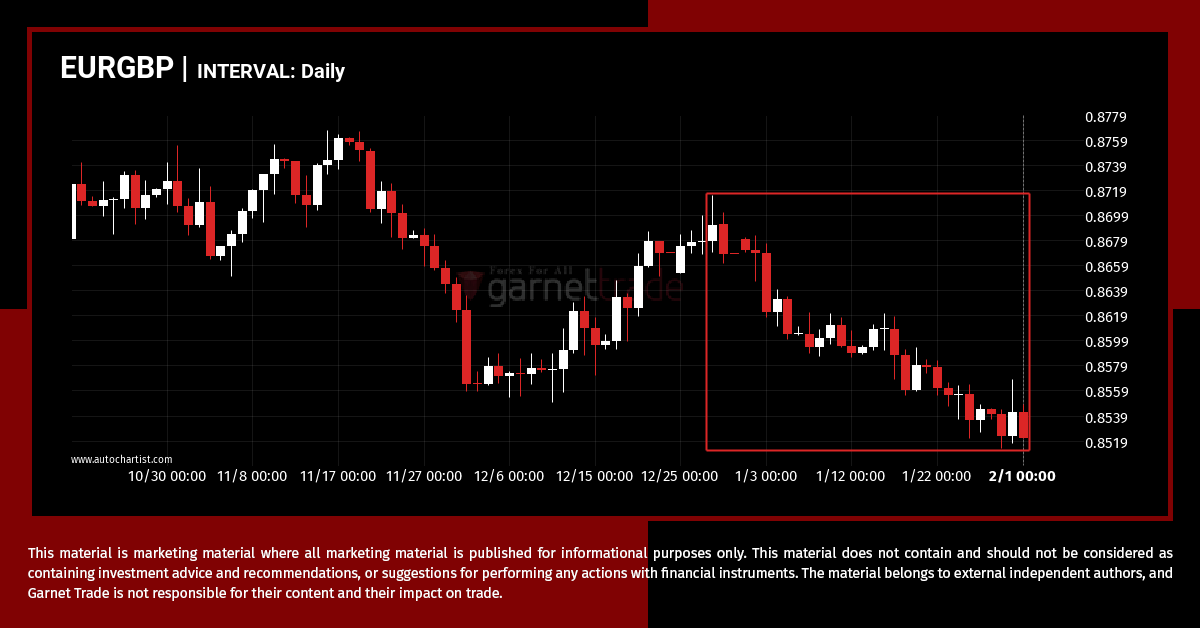
For those of you that don’t believe in trends, this may be an opportunity to take advantage of an exceptional 1.95% move on EURGBP. The movement has happened over the last 36 days. For those trend followers among you, you may think about riding this possible trend.
UKX.IND – Reversal Chart Pattern – Rising Wedge
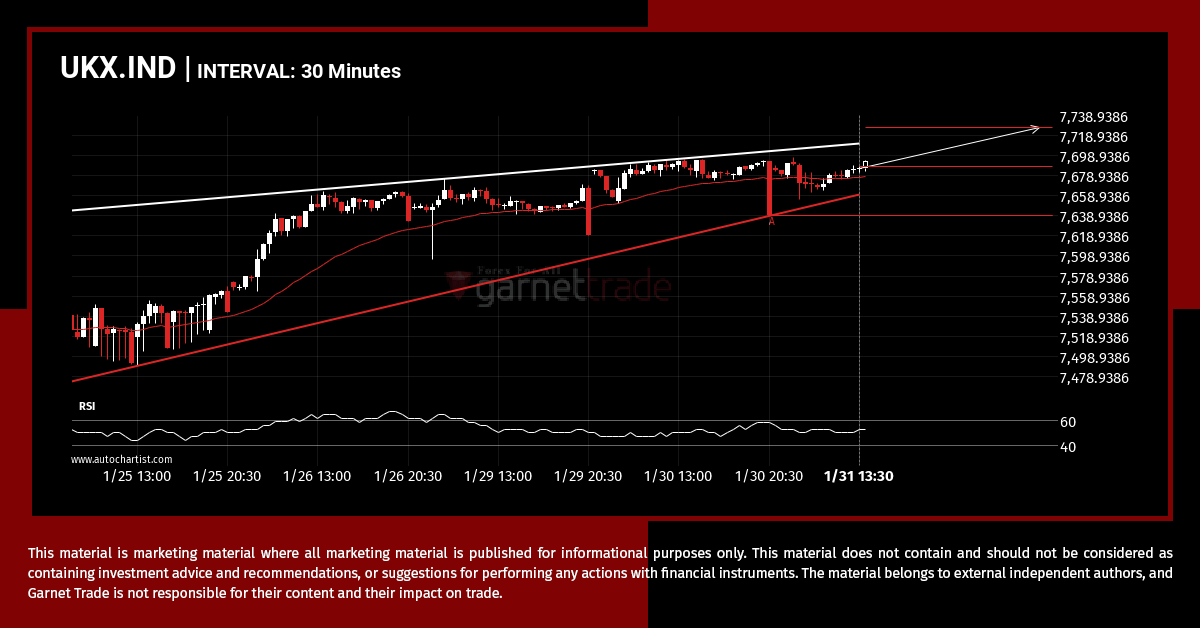
UKX.IND is moving towards a resistance line. Because we have seen it retrace from this line before, we could see either a break through this line, or a rebound back to current levels. It has touched this line numerous times in the last 7 days and may test it again within the next 19 hours.
XAGUSD approaching support level
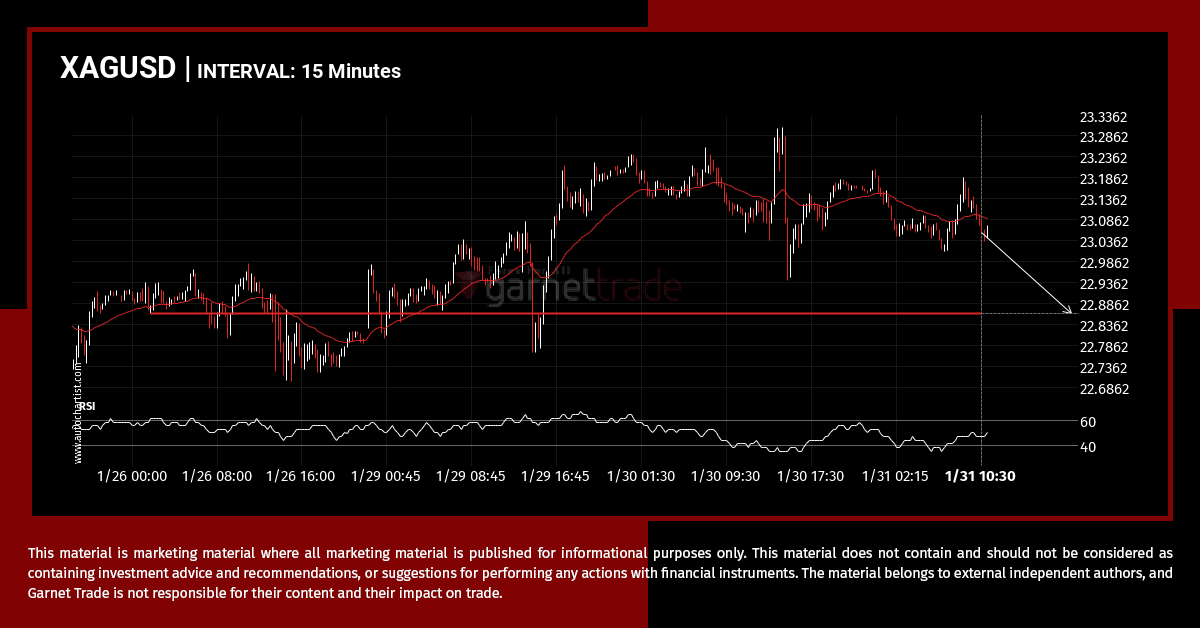
XAGUSD is moving towards a support line. Because we have seen it retrace from this level in the past, we could see either a break through this line, or a rebound back to current levels. It has touched this line numerous times in the last 6 days and may test it again within the next […]
What’s going on with EURGBP?
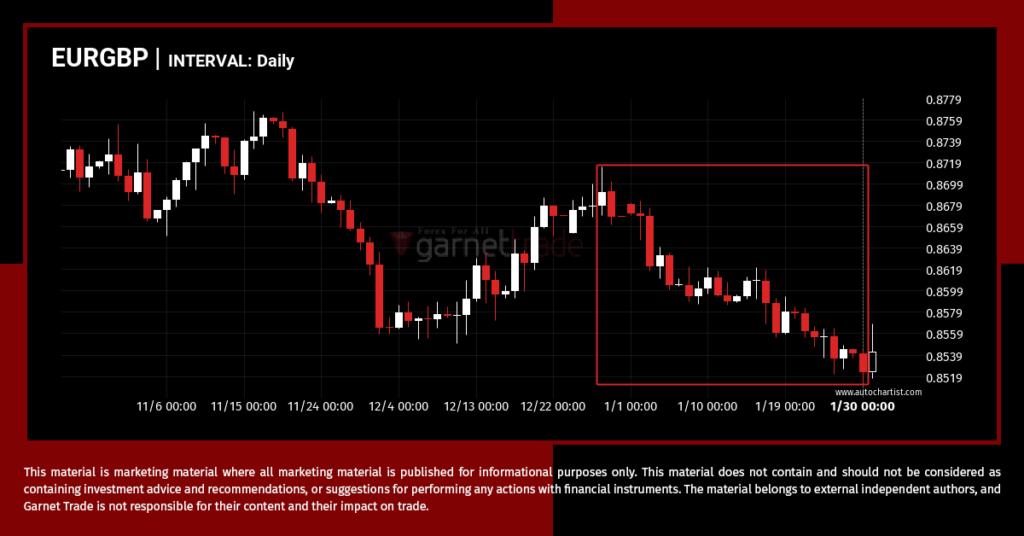
Those of you that are trend followers are probably eagerly watching EURGBP to see if its latest 1.94% move continues. If not, the mean-reversion people out there will be delighted with this exceptionally large 34 days move.
Falling Wedge breakout on EURUSD
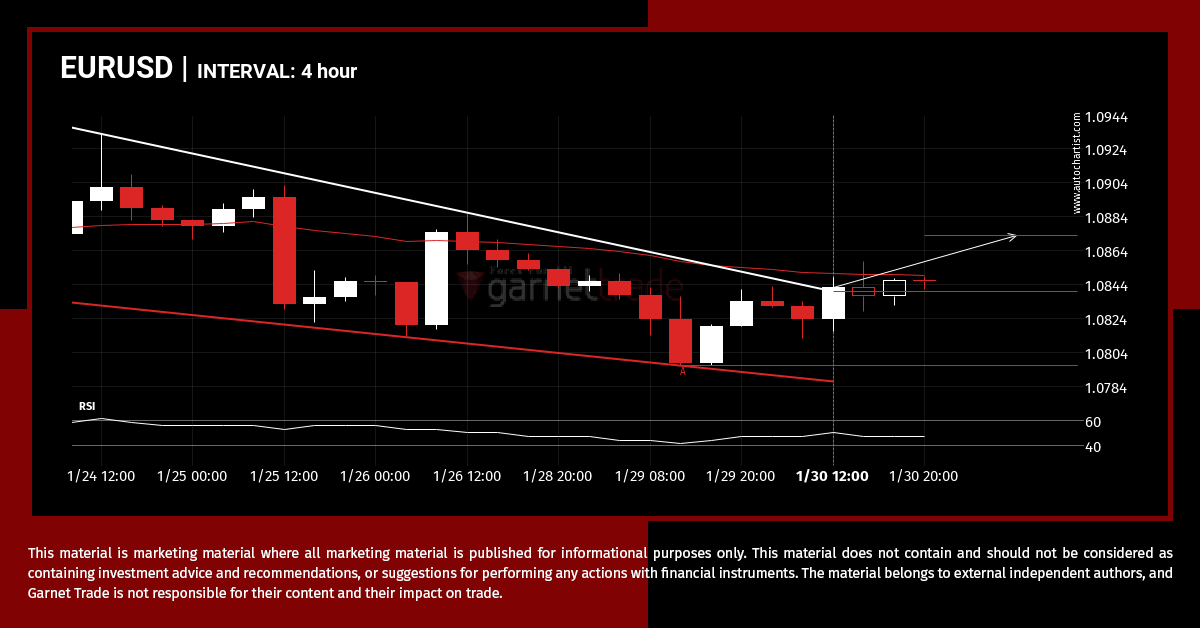
EURUSD has broken through a resistance line of a Falling Wedge chart pattern. If this breakout holds true, we may see the price of EURUSD testing 1.0872 within the next 18 hours. But don’t be so quick to trade, it has tested this line in the past, so you should confirm the breakout before taking […]
Should we expect a breakout or a rebound on USDCHF?
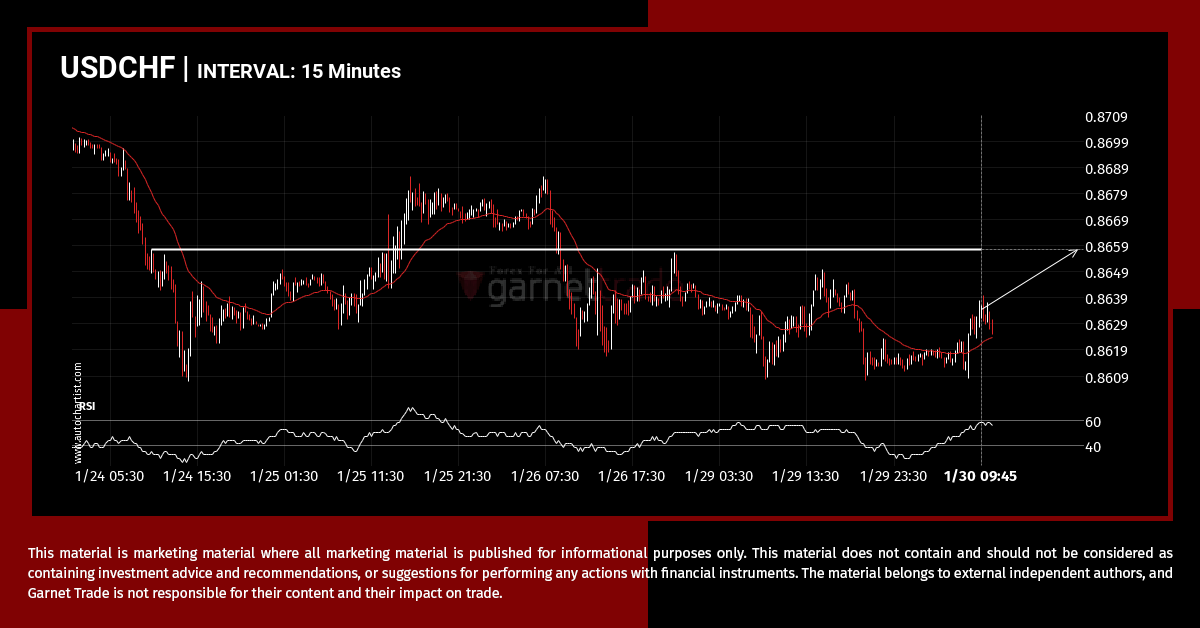
The movement of USDCHF towards 0.8657 price line is yet another test of the line it reached numerous times in the past. We could expect this test to happen in the next 22 hours, but it is uncertain whether it will result in a breakout through this line, or simply rebound back to current lines.
AUDUSD – Reversal Chart Pattern – Rising Wedge
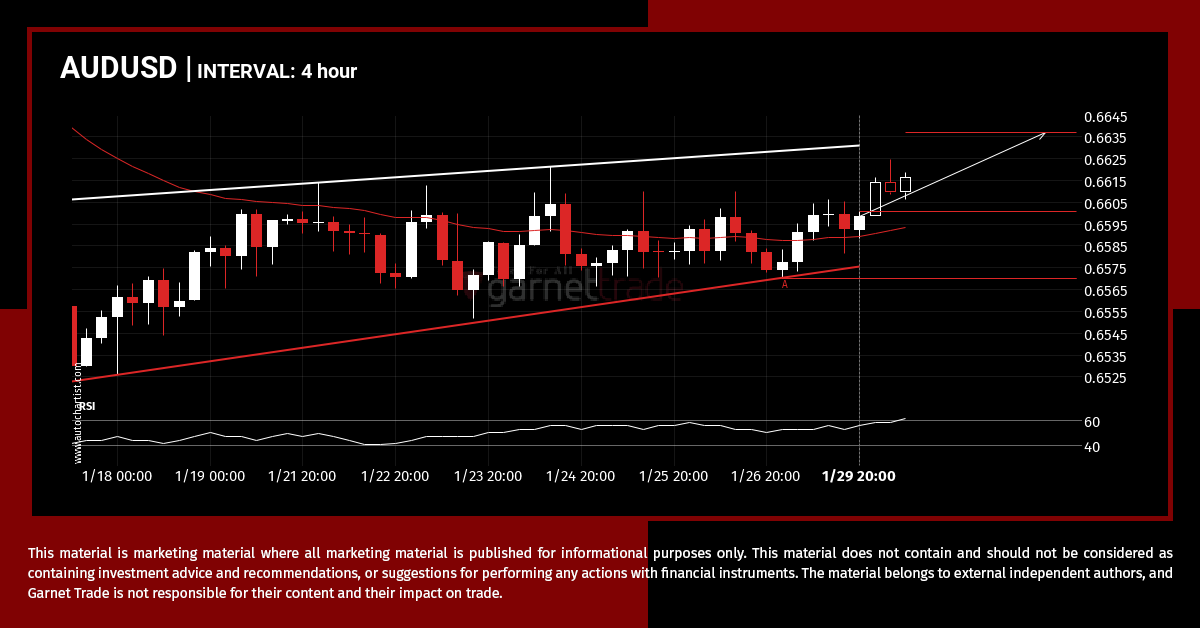
Emerging Rising Wedge detected on AUDUSD – the pattern is an emerging one and has not yet broken through support, but the price is expected to move up over the next few hours. The price at the time the pattern was found was 0.66007 and it is expected to move to 0.6637.
Should we expect a breakout or a rebound on USDCAD?
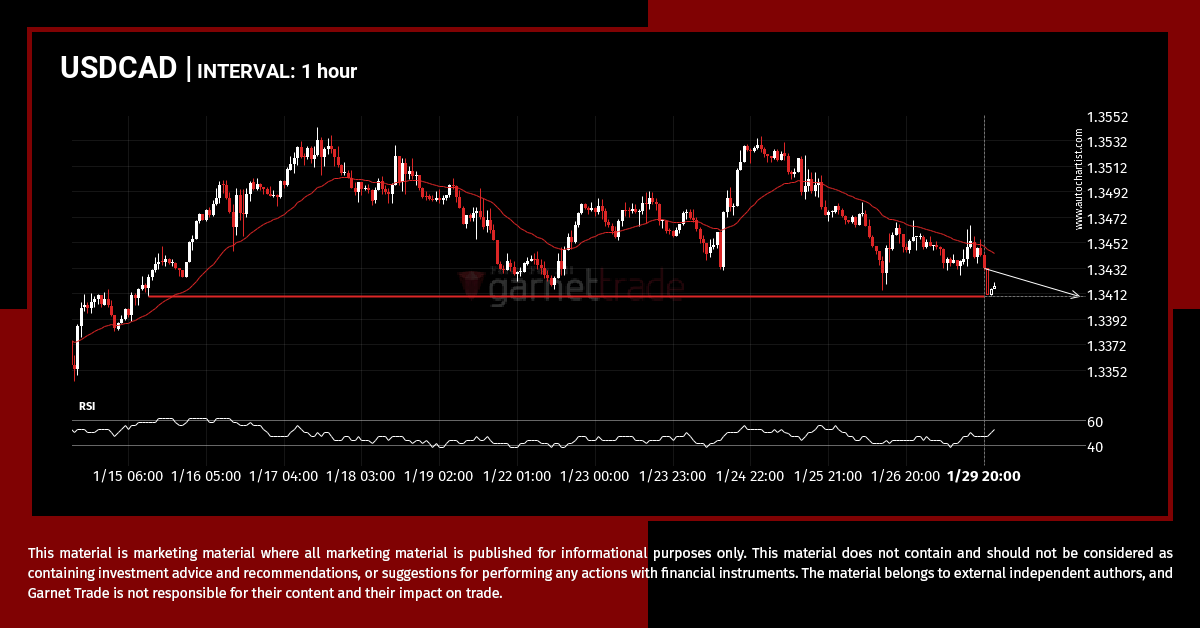
USDCAD is en route to a very important line that will be a definite deciding factor of what is to come! We may see this trajectory continue to touch and break through 1.3410, unless it runs out of momentum and pulls back to current levels.