
SPX.IND approaches important level of 5260.2100
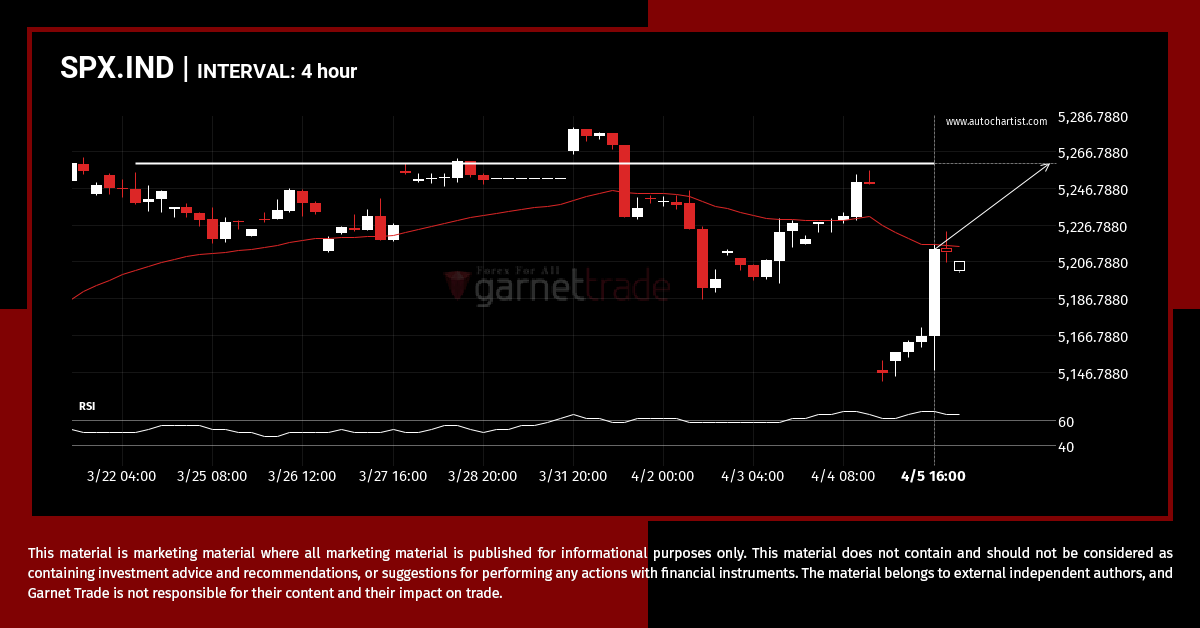
SPX.IND is moving towards a key resistance level at 5260.2100. SPX.IND has previously tested this level 3 times and on each occasion it has bounced back off this level. Is this finally the time it will break through?
XAGUSD approaching resistance level
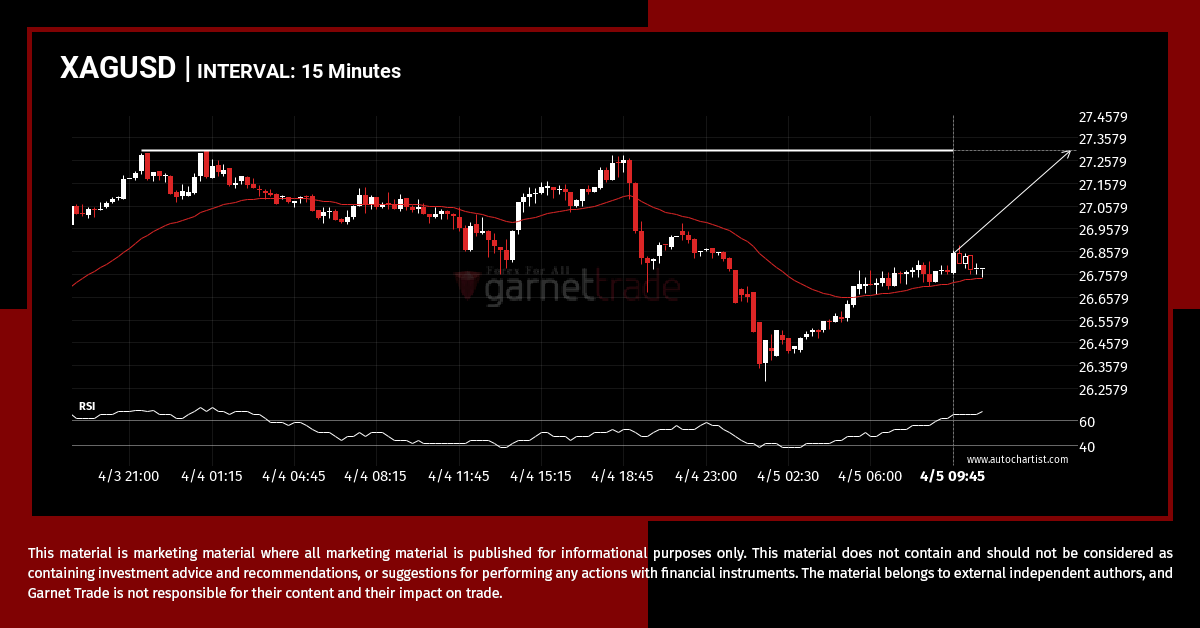
A strong resistance level has been identified at 27.3010 on the 15 Minutes XAGUSD chart. XAGUSD is likely to test it soon.
USDCHF – support line breached
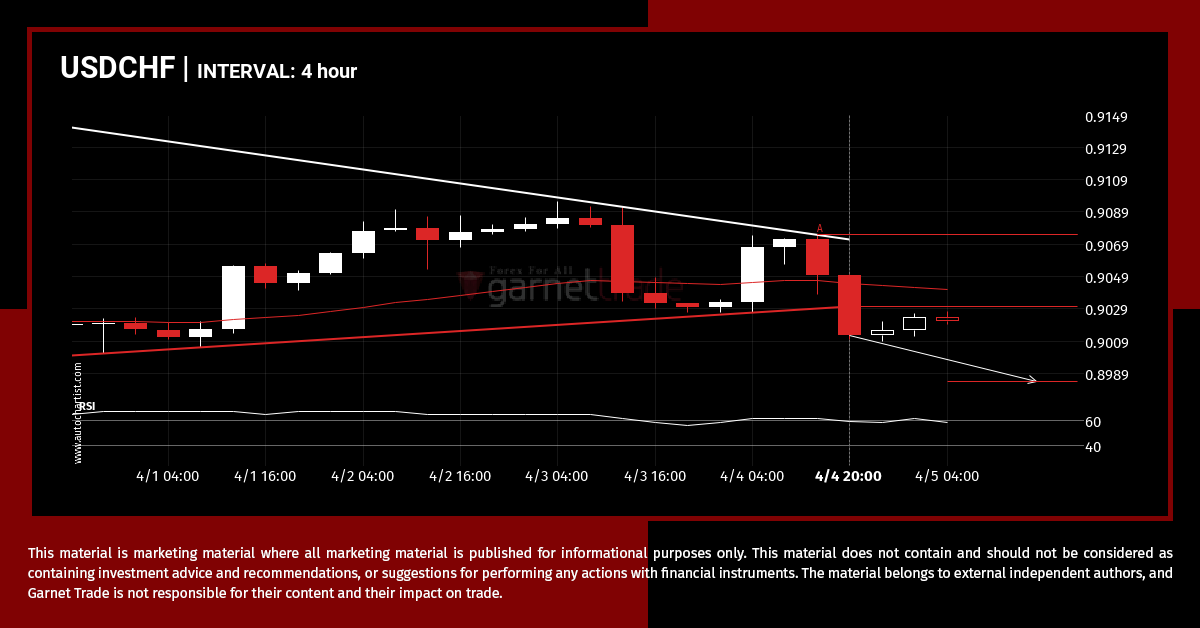
The last 9 4 hour candles on USDCHF formed a Triangle pattern and broken out through the pattern lines, indicating a possible bearish movement towards the price level of 0.8984.
NDX.IND – Extreme movement, a rare opportunity
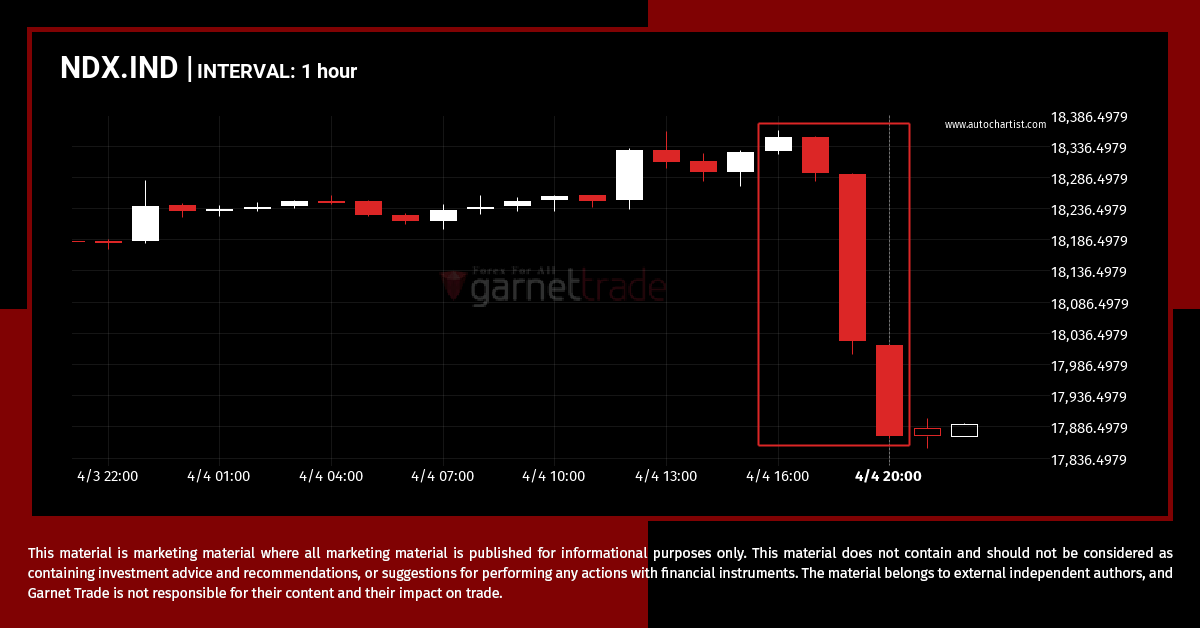
NDX.IND dropped sharply for 4 hours – which is an excessively big movement for this instrument; exceeding the 98% of past price moves. Even if this move is a sign of a new trend in NDX.IND there is a chance that we will witness a correction, no matter how brief.
USDTRY – support line broken at 2024-04-04T09:30:00.000Z
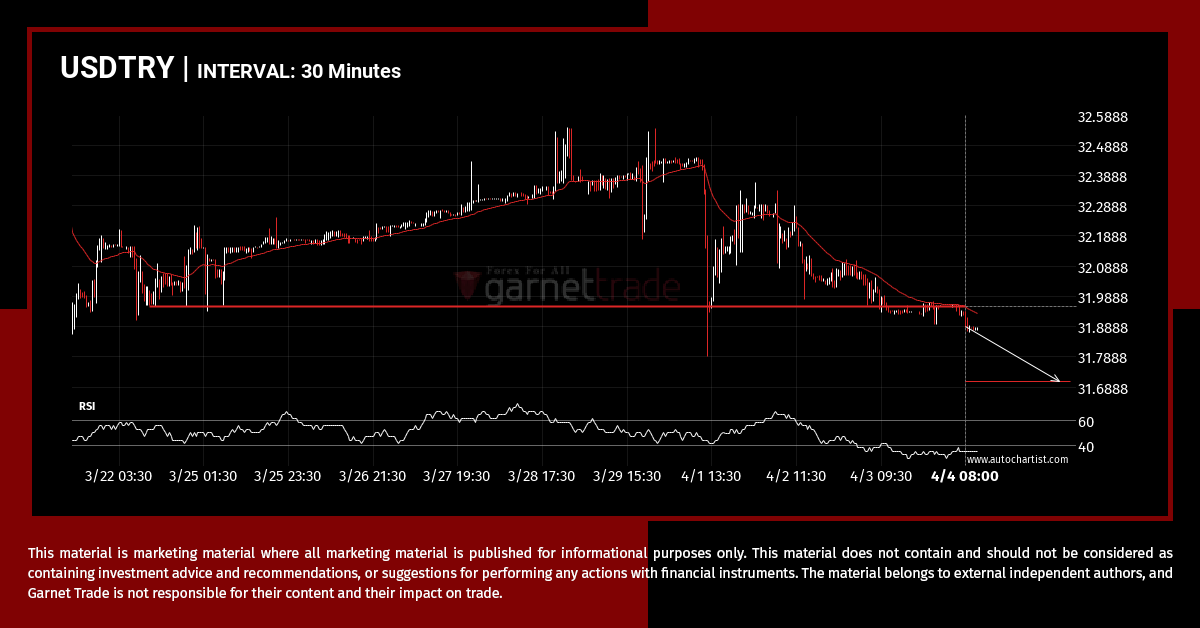
USDTRY has broken through a support line. It has touched this line numerous times in the last 13 days. This breakout shows a potential move to 31.7080 within the next 3 days. Because we have seen it retrace from this level in the past, one should wait for confirmation of the breakout.
GBPUSD has broken through resistance
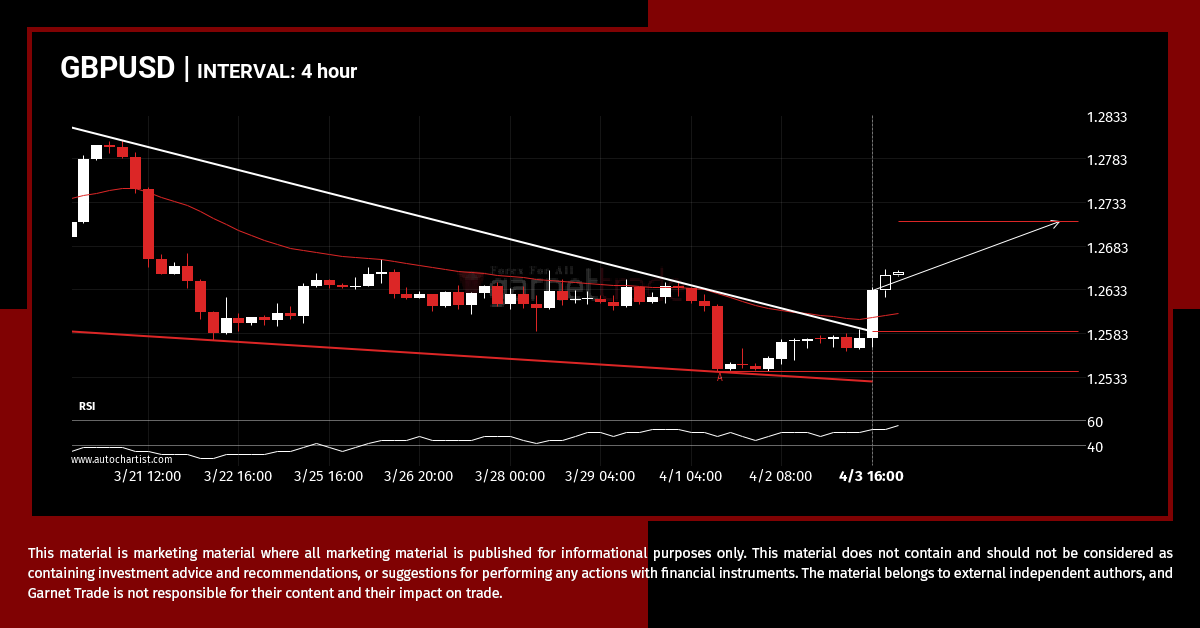
This trade setup on GBPUSD is formed by a period of consolidation; a period in which the price primarily moves sideways before choosing a new direction for the longer term. Because of the bullish breakout through resistance, it seems to suggest that we could see the next price move to 1.2712.
Breach of important price line imminent by AUDUSD
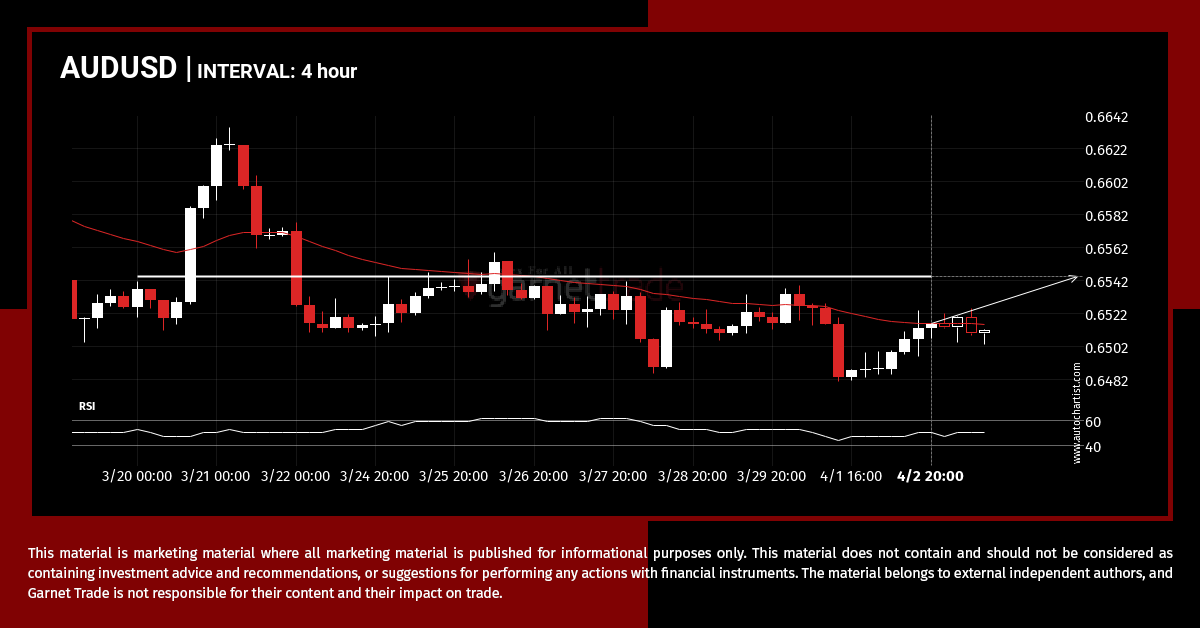
AUDUSD is heading towards 0.6544 and could reach this point within the next 2 days. It has tested this line numerous times in the past, and this time could be no different, ending in a rebound instead of a breakout. If the breakout doesn’t happen, we could see a retracement back down to current levels.
Where is USDCHF moving to?
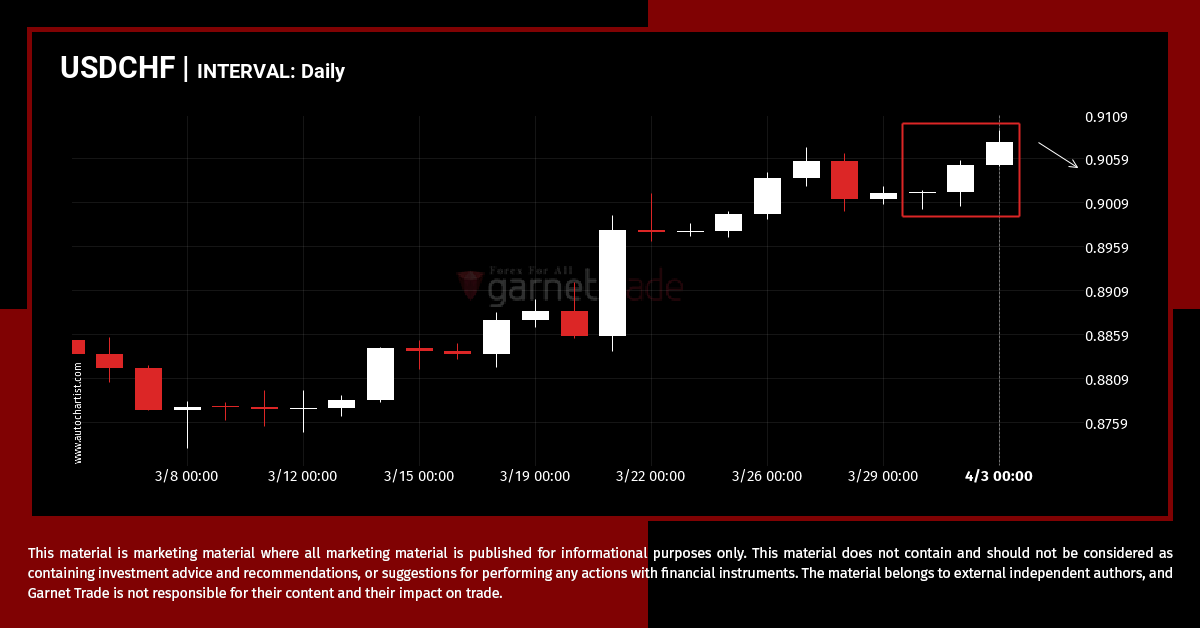
After posting 5 consecutive bullish candles in 4 days, you may start considering where USDCHF is heading next, a continuation of the current upward trend, or a reversal in the previous direction.
GBPUSD is on its way down
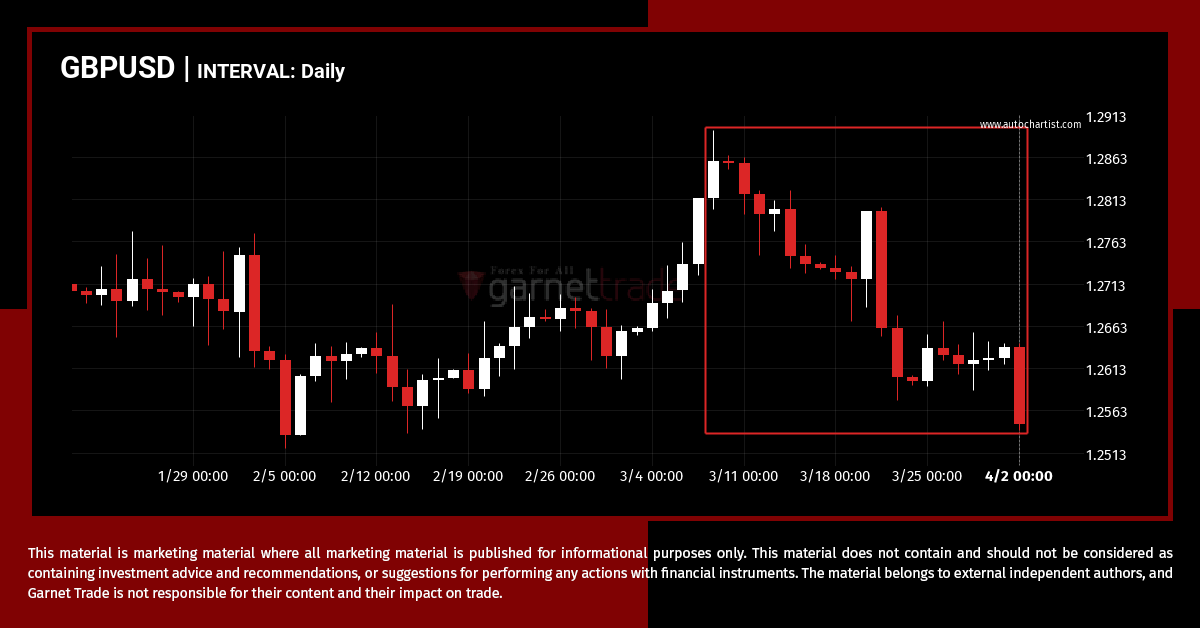
GBPUSD hits 1.25463 after a 2.42% move spanning 26 days.
XAGUSD – psychological price line breached
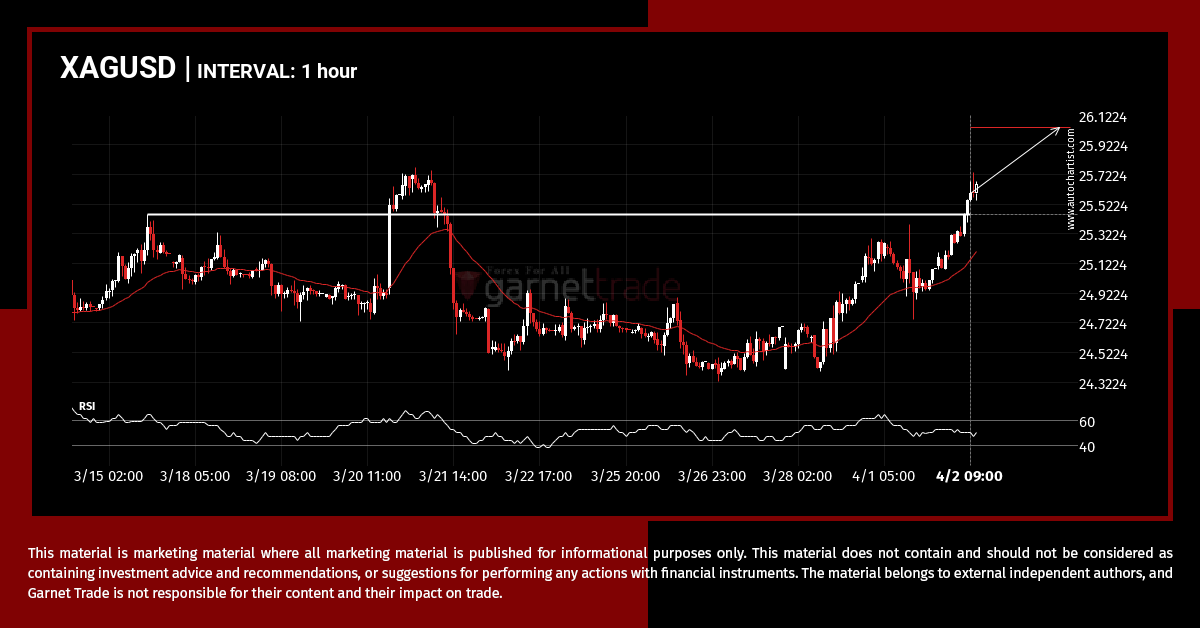
XAGUSD has broken through a resistance line. Because we have seen it retrace from this price in the past, one should wait for confirmation of the breakout before trading. It has touched this line numerous times in the last 18 days and suggests a possible target level to be around 26.0370 within the next 3 […]