
Possibility of big movement expected on AUDUSD
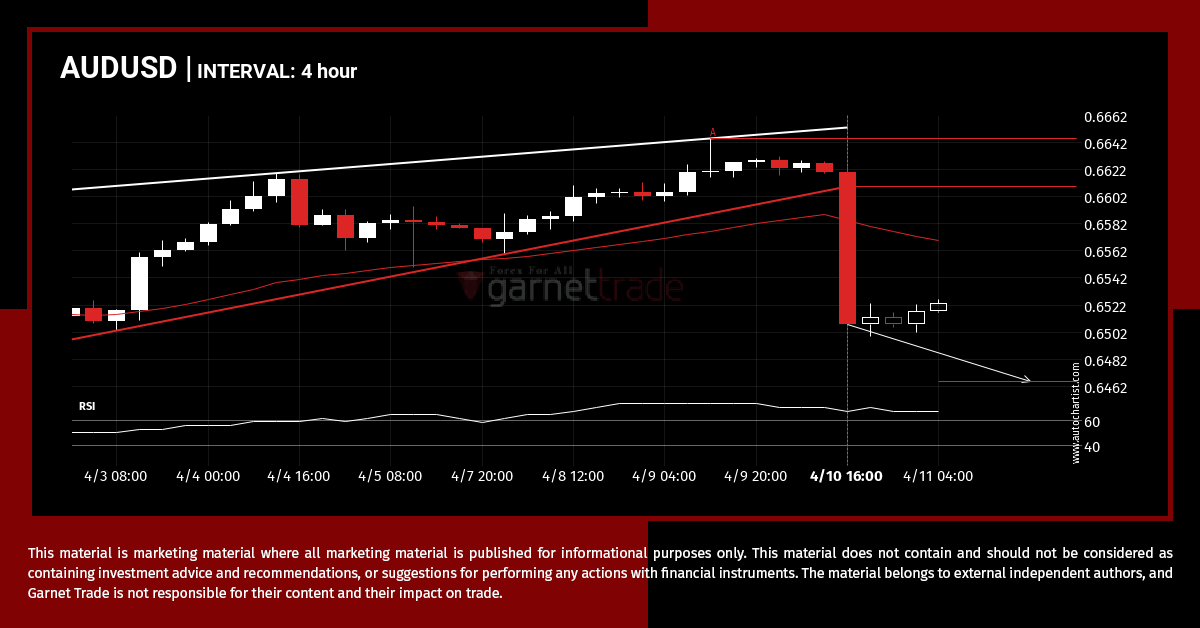
AUDUSD moved through the support line of a Rising Wedge at 0.6608988235294116 on the 4 hour chart. This line has been tested a number of times in the past and this breakout could mean an upcoming change from the current trend. It may continue in its current direction toward 0.6466.
EURGBP approaching important level of 0.8583
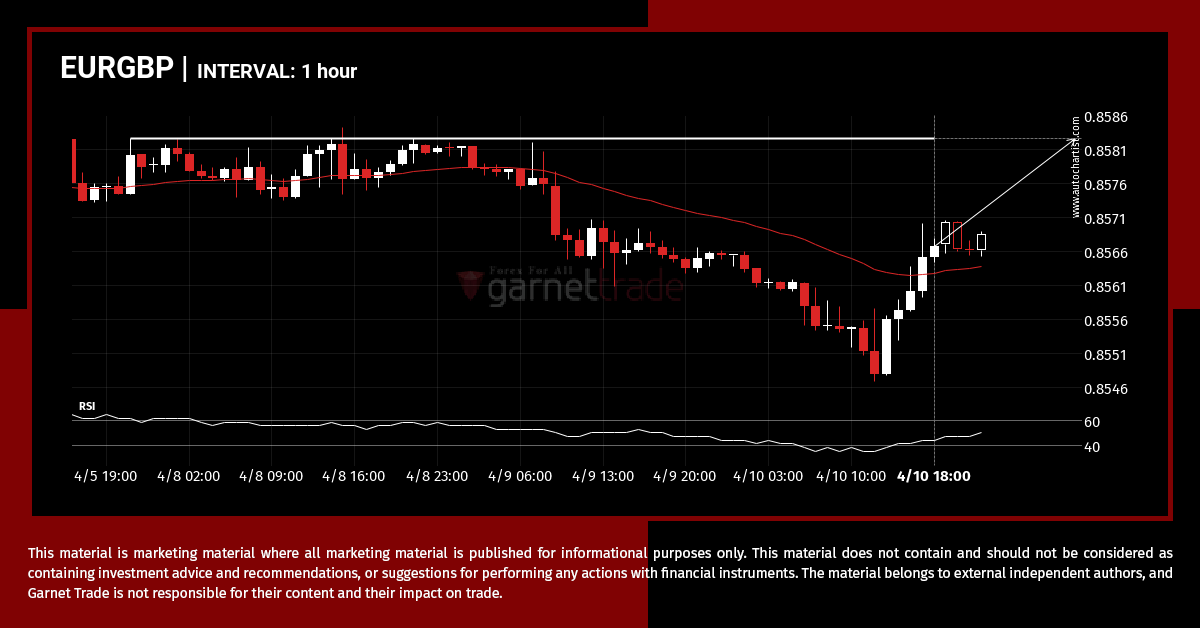
EURGBP is moving towards a resistance line. Because we have seen it retrace from this level in the past, we could see either a break through this line, or a rebound back to current levels. It has touched this line numerous times in the last 3 days and may test it again within the next […]
EURUSD approaching resistance of a Rising Wedge
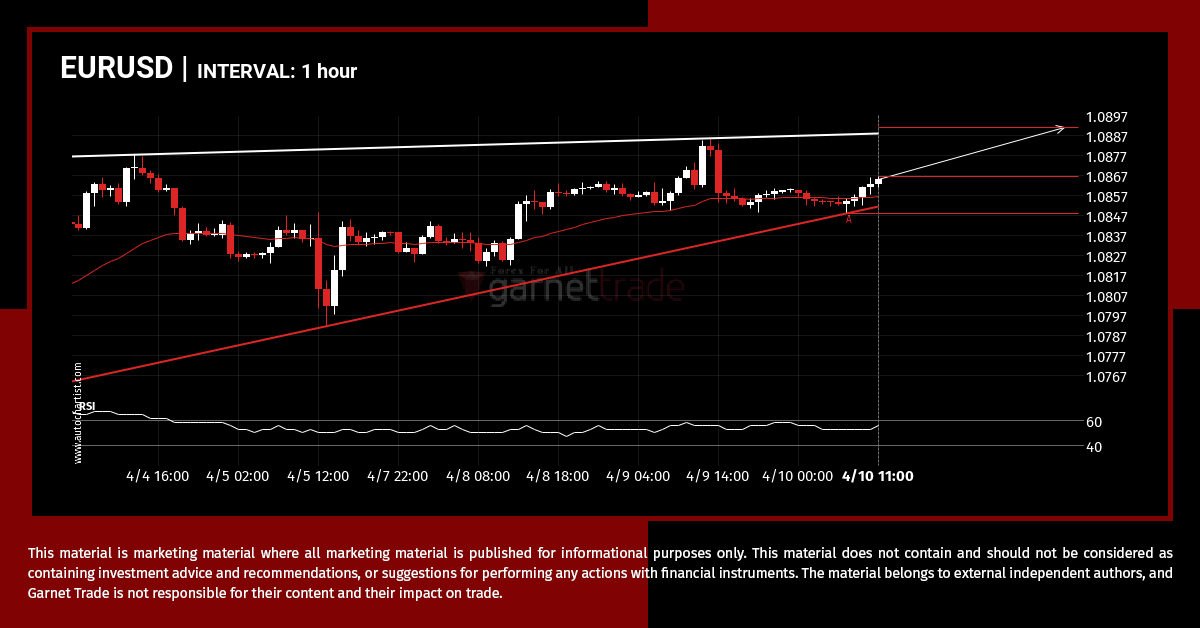
EURUSD is trapped in a Rising Wedge formation, implying that a breakout is Imminent. This is a great trade-setup for both trend and swing traders. It is now approaching a support line that has been tested in the past. Divergence opportunists may be very optimistic about a possible breakout and this may be the start […]
Important price line breached by UKX.IND
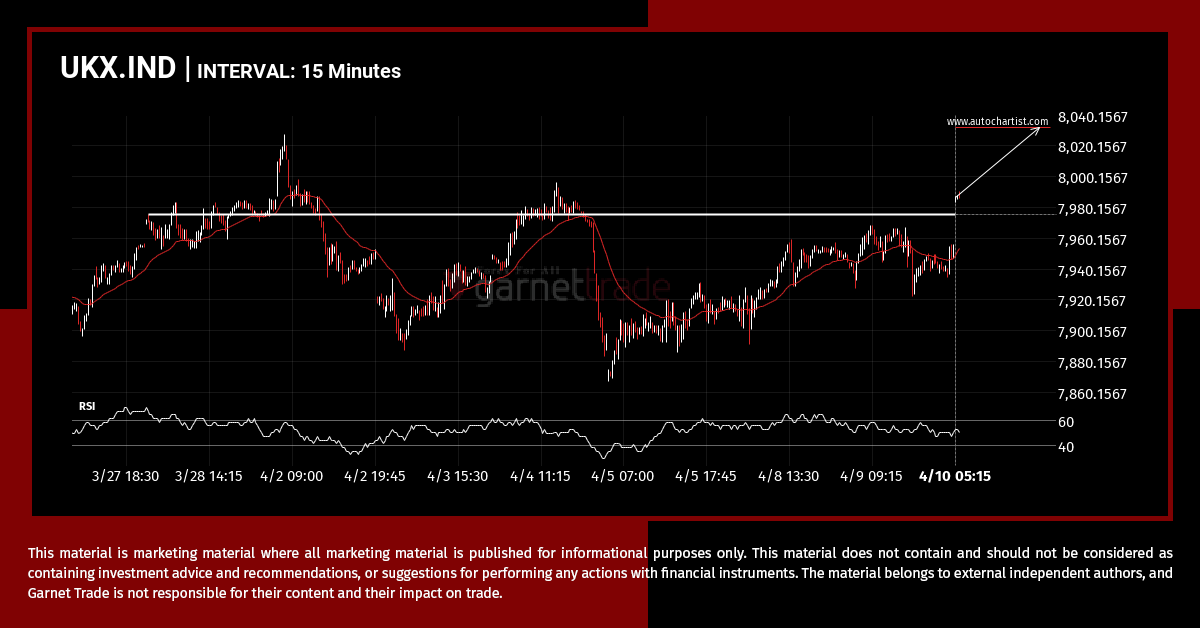
UKX.IND has broken through a resistance line. Because we have seen it retrace from this price in the past, one should wait for confirmation of the breakout before trading. It has touched this line numerous times in the last 13 days and suggests a possible target level to be around 8031.9302 within the next 2 […]
Possible breach of support level by USDCHF
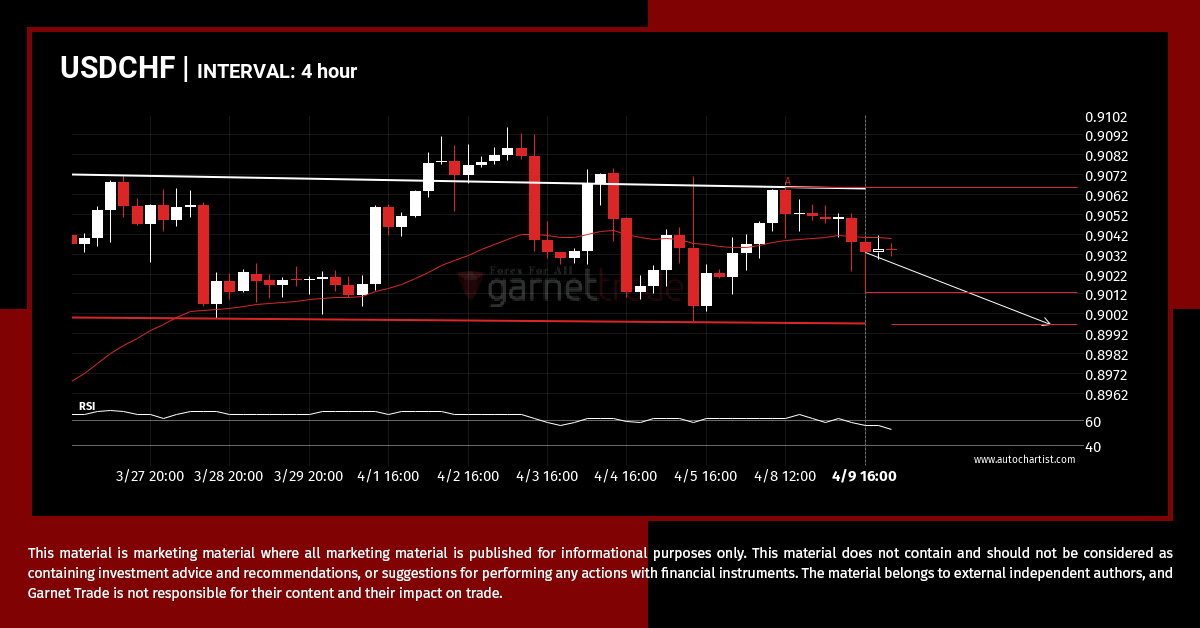
USDCHF is moving towards a support line which it has tested numerous times in the past. We have seen it retrace from this line before, so at this stage it isn’t clear whether it will breach this line or rebound as it did before. If USDCHF continues in its current trajectory, we could see it […]
A potential bearish movement on NDX.IND
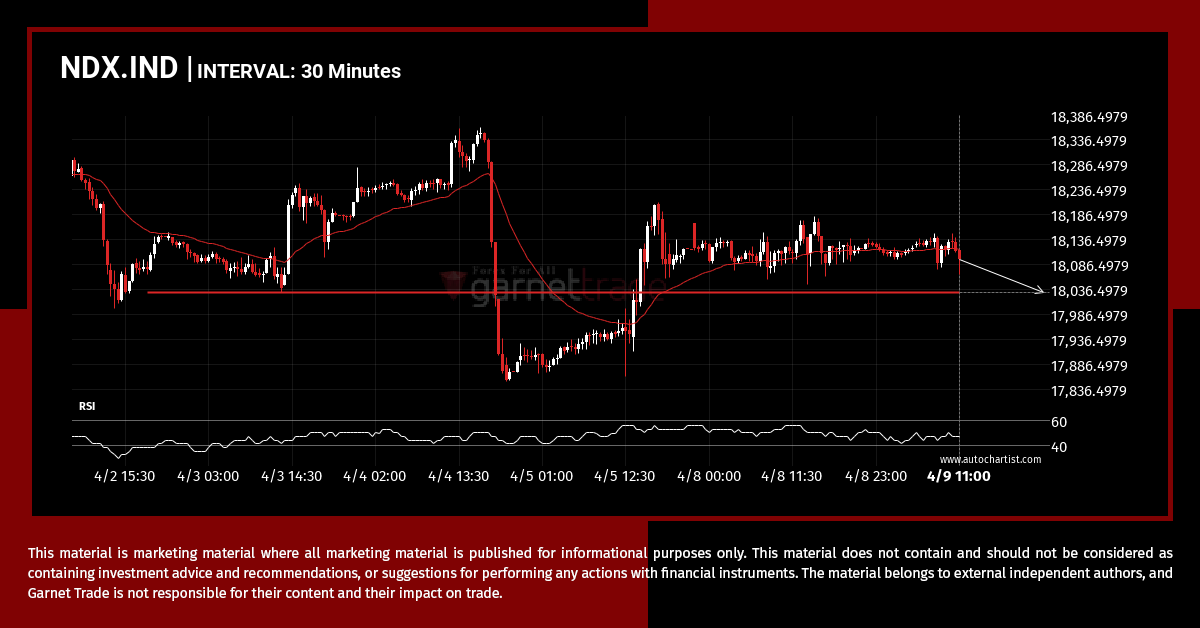
NDX.IND is heading towards a line of 18029.5176. If this movement continues, the price of NDX.IND could test 18029.5176 within the next 2 days. But don’t be so quick to trade, it has tested this line numerous times in the past, so this movement could be short-lived and end up rebounding.
EURUSD – Continuation Chart Pattern – Rising Wedge
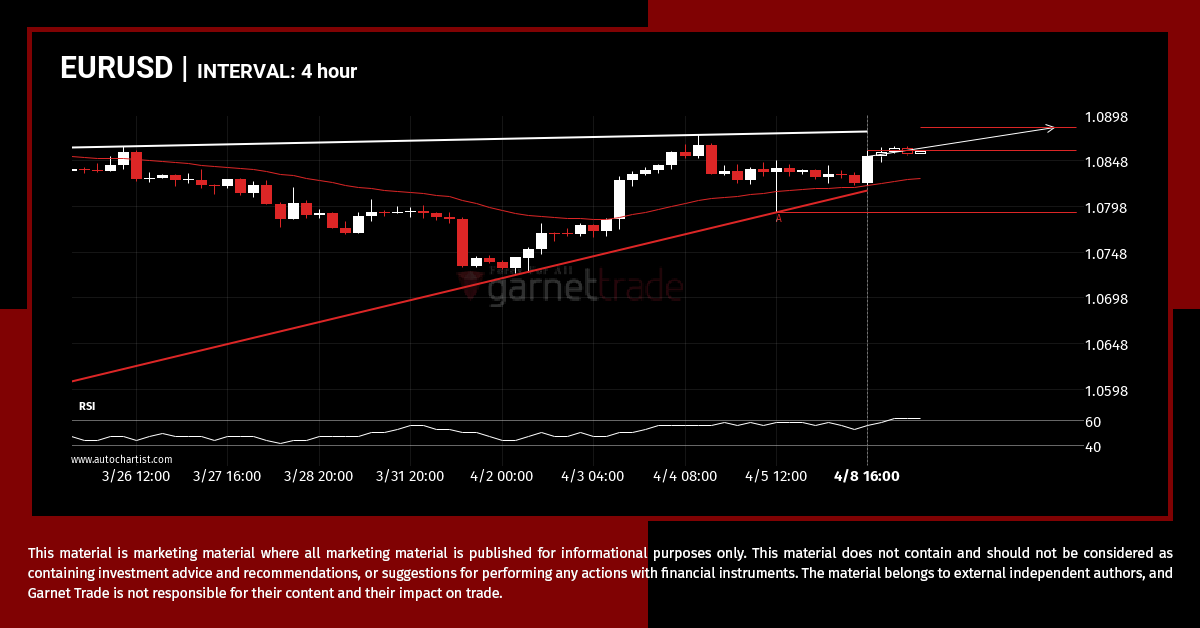
EURUSD is moving towards a resistance line. Because we have seen it retrace from this line before, we could see either a break through this line, or a rebound back to current levels. It has touched this line numerous times in the last 18 days and may test it again within the next 3 days.
Either a rebound or a breakout imminent on AUDUSD
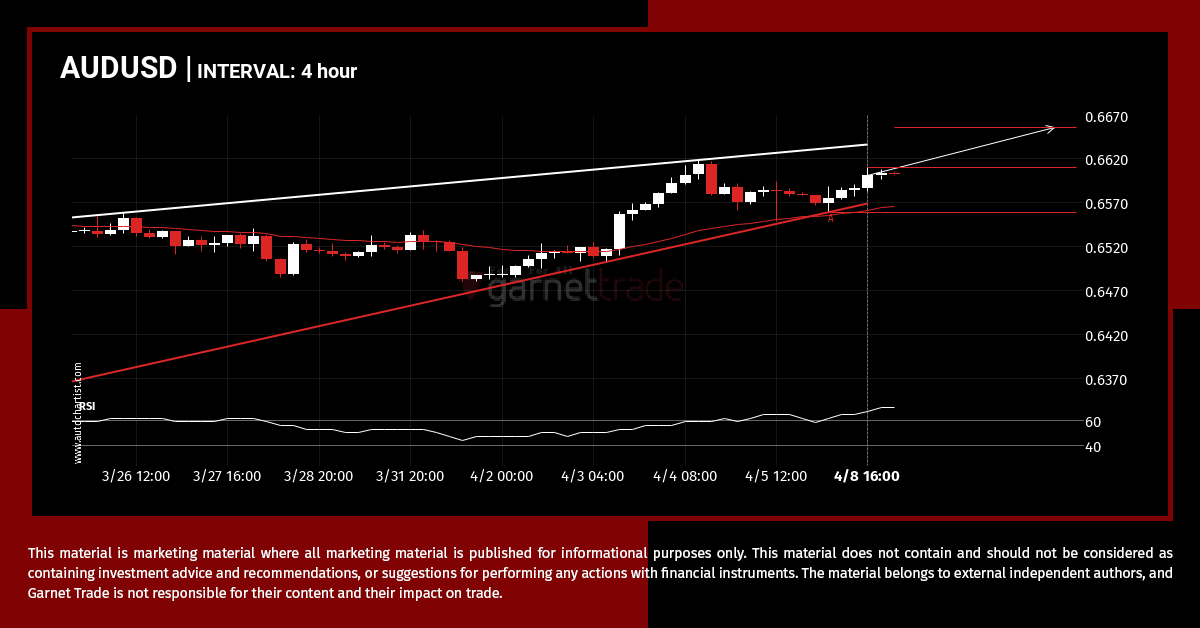
AUDUSD was identified at around 0.66102 having recently rebounded of the support on the 4 hour data interval. Ultimately, the price action of the stock has formed a Rising Wedge pattern. This squeeze may increases the chances of a strong breakout. The projected movement will potentially take the price to around the 0.6656 level.
A final push possible on USDCHF
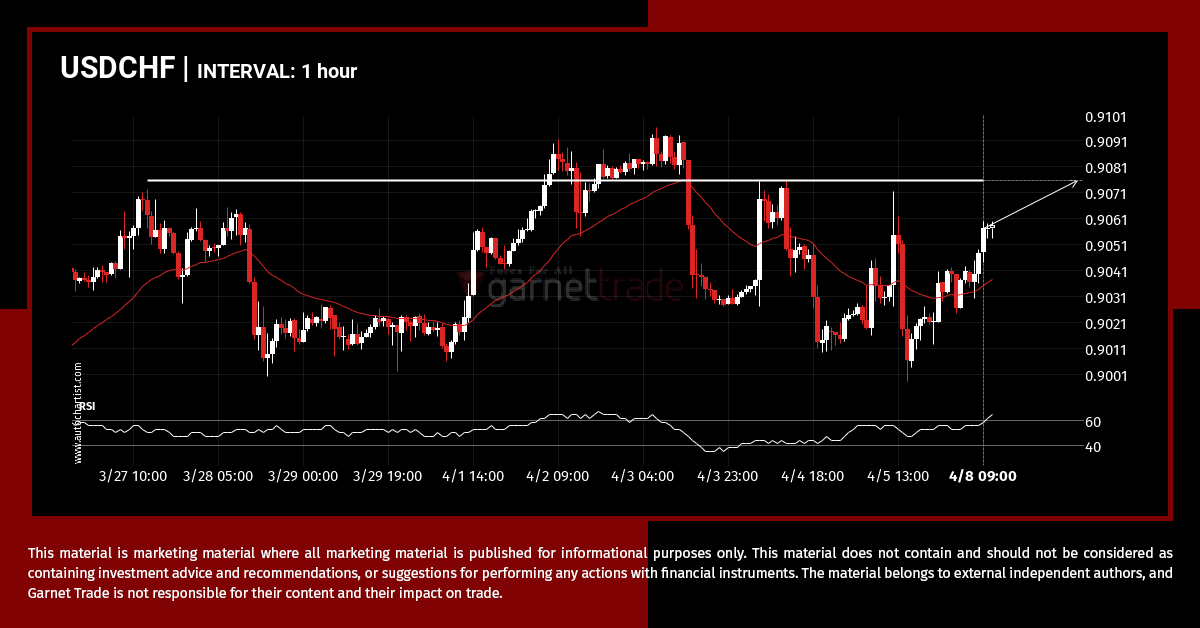
USDCHF is approaching a resistance line at 0.9075. If it hits the resistance line, it may break through this level to continue the bullish trend, or it may turn around back to current levels.
A potential bullish movement on XAGUSD
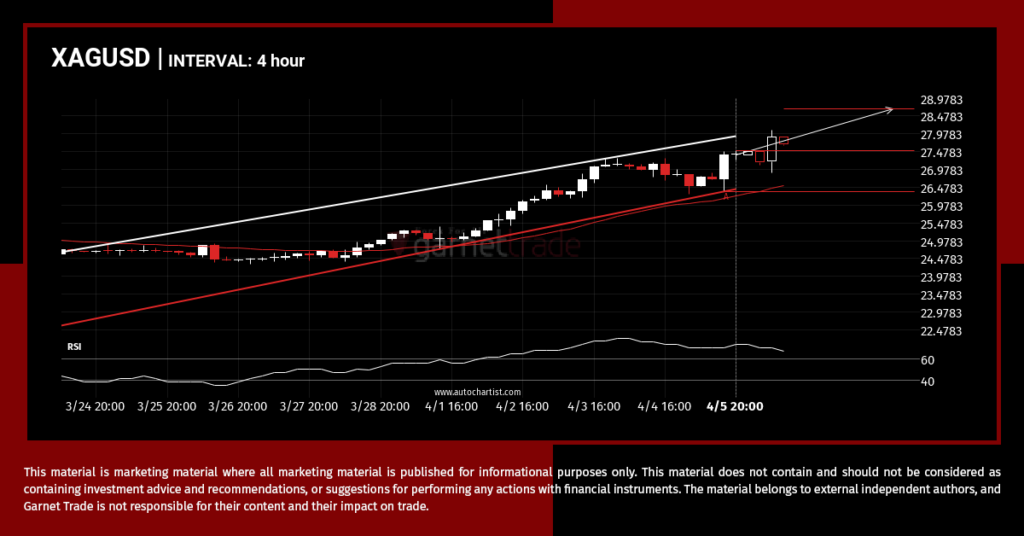
A Channel Up pattern was identified on XAGUSD at 27.495, creating an expectation that it may move to the resistance line at 28.6747. It may break through that line and continue the bullish trend or it may reverse from that line.