EURUSD broke through important 1.0841 price line
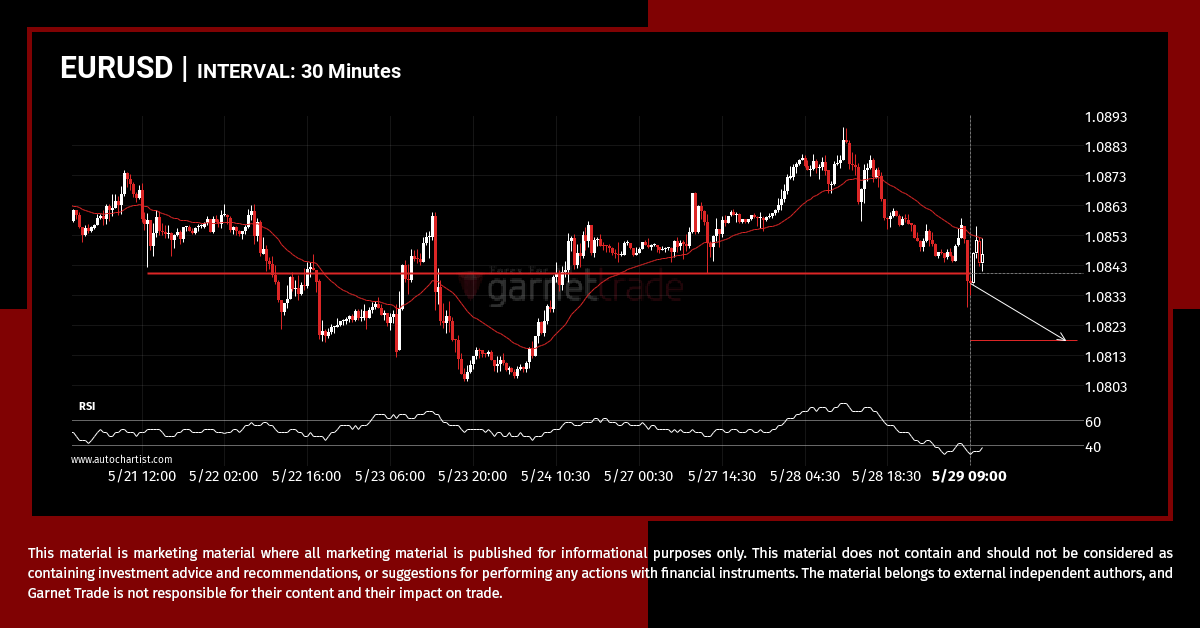
EURUSD has broken through a line of 1.0841 and suggests a possible movement to 1.0818 within the next 2 days. It has tested this line numerous times in the past, so one should wait for a confirmation of this breakout before taking any action. If the breakout doesn’t confirm, we could see a retracement back […]
NDX.IND is moving, act now
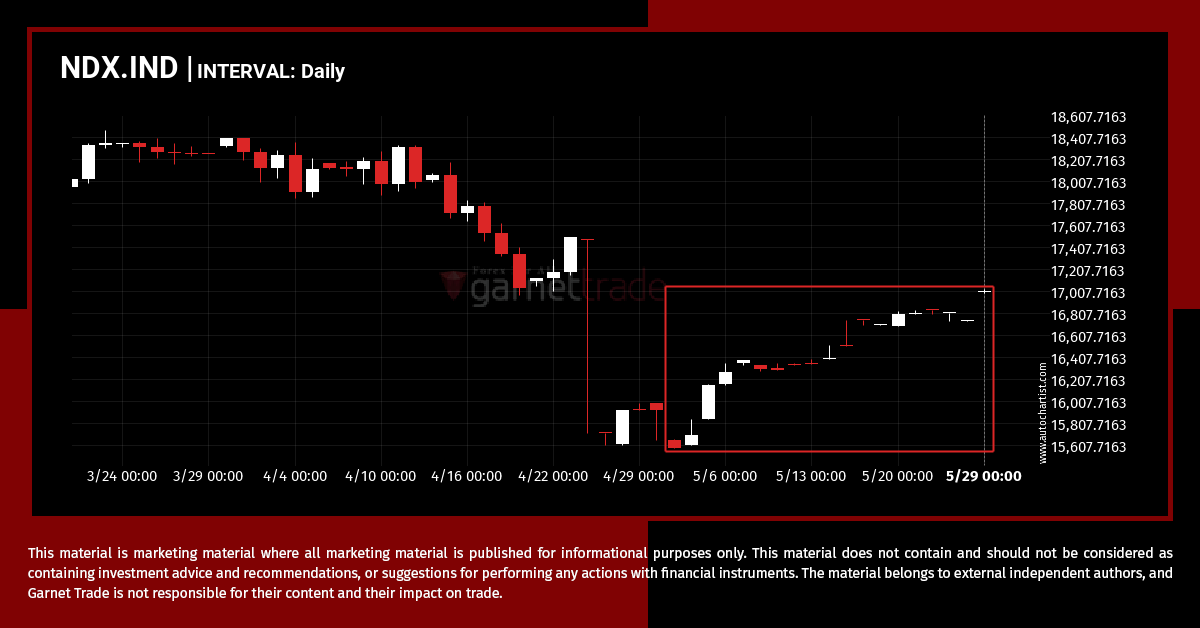
NDX.IND has moved higher by 9.06% from 15581.843 to 16994.0612 in the last 29 days.
Will GBPUSD have enough momentum to break support?
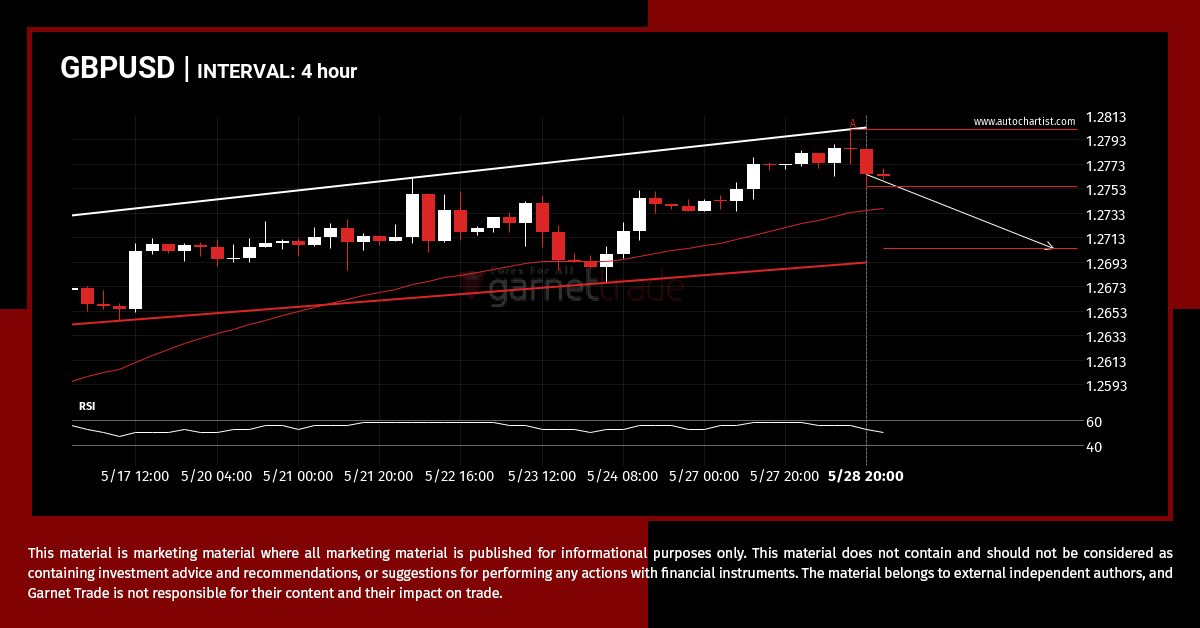
GBPUSD is heading towards the support line of a Channel Up and could reach this point within the next 3 days. It has tested this line numerous times in the past, and this time could be no different from the past, ending in a rebound instead of a breakout. If the breakout doesn’t happen, we […]
Important price line breached by SPX.IND
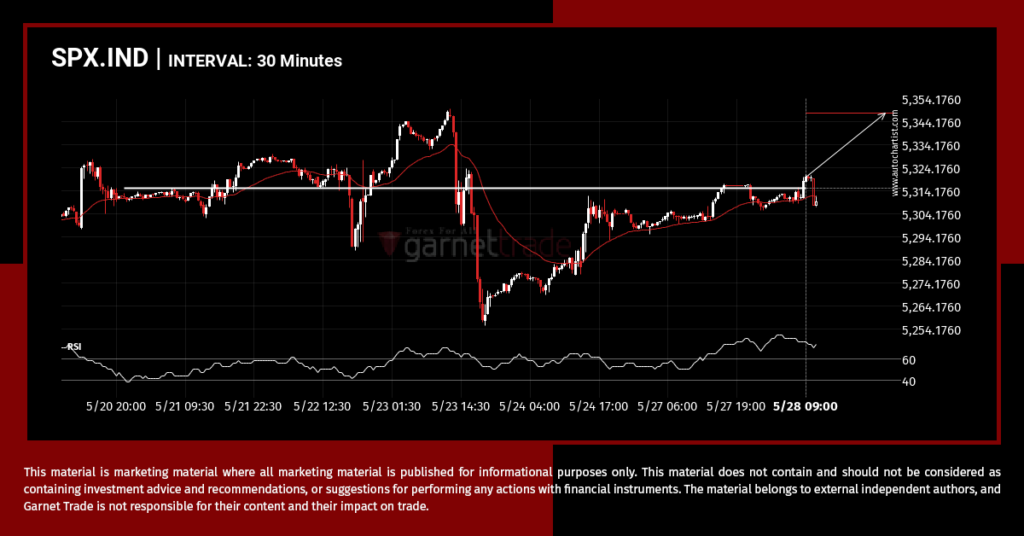
A strong resistance level has been breached at 5314.9800 on the 30 Minutes SPX.IND chart. Technical Analysis theory forecasts a movement to 5347.7339 in the next day.
USDCHF breakout through support
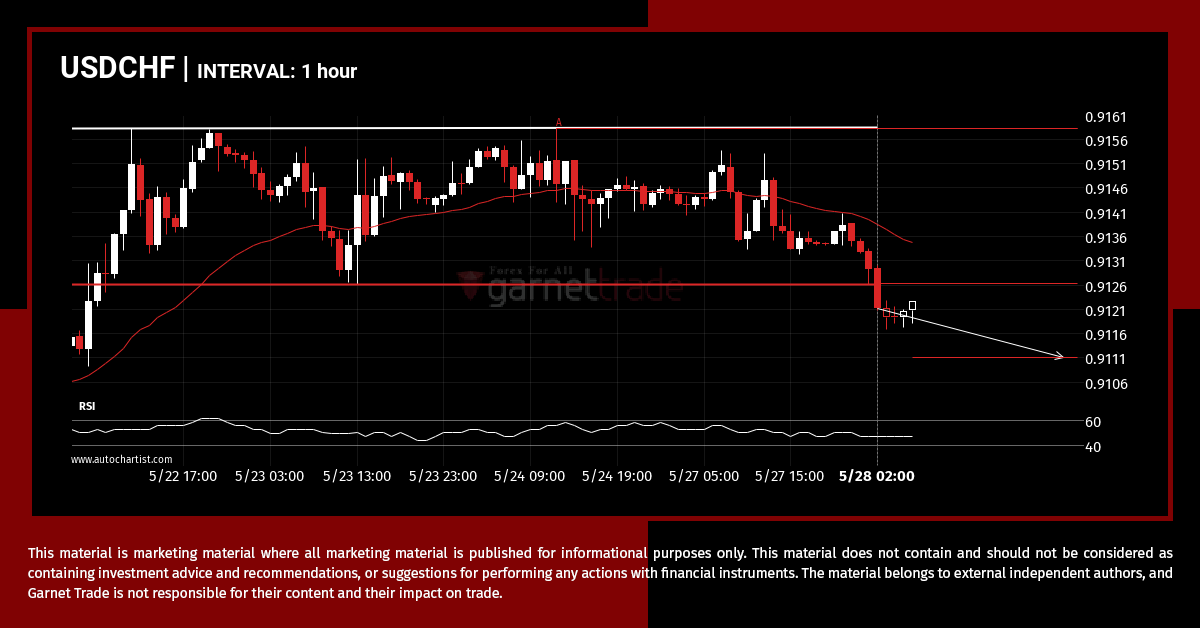
USDCHF has broken through the support line of a Double Top technical chart pattern. Because we have seen it retrace from this line in the past, one should wait for confirmation of the breakout before taking any action. It has touched this line twice in the last 7 days and suggests a possible target level […]
DAX.IND – psychological price line breached
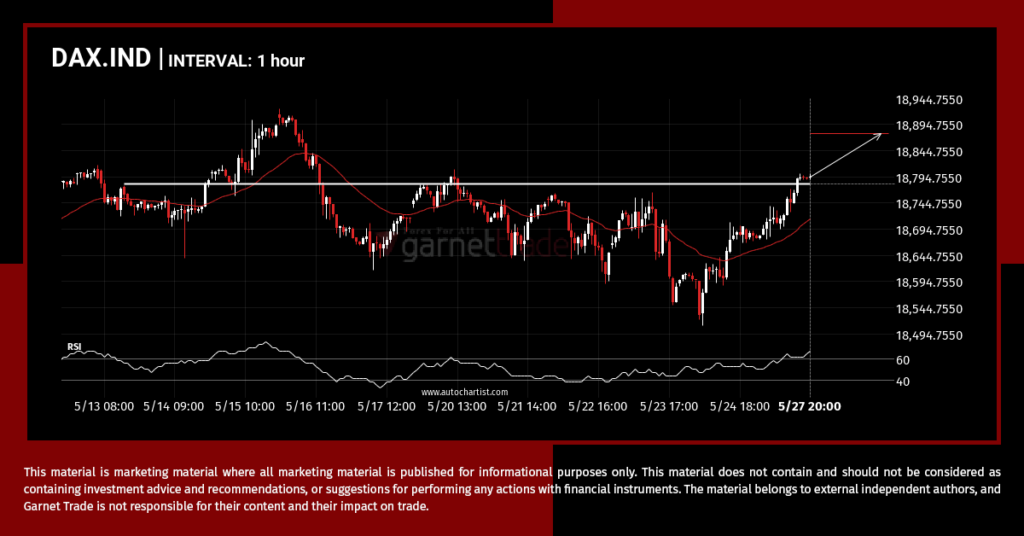
DAX.IND has broken through a resistance line. It has touched this line numerous times in the last 15 days. This breakout shows a potential move to 18876.5898 within the next 3 days. Because we have seen it retrace from this level in the past, one should wait for confirmation of the breakout.
Where is AUDUSD moving to?
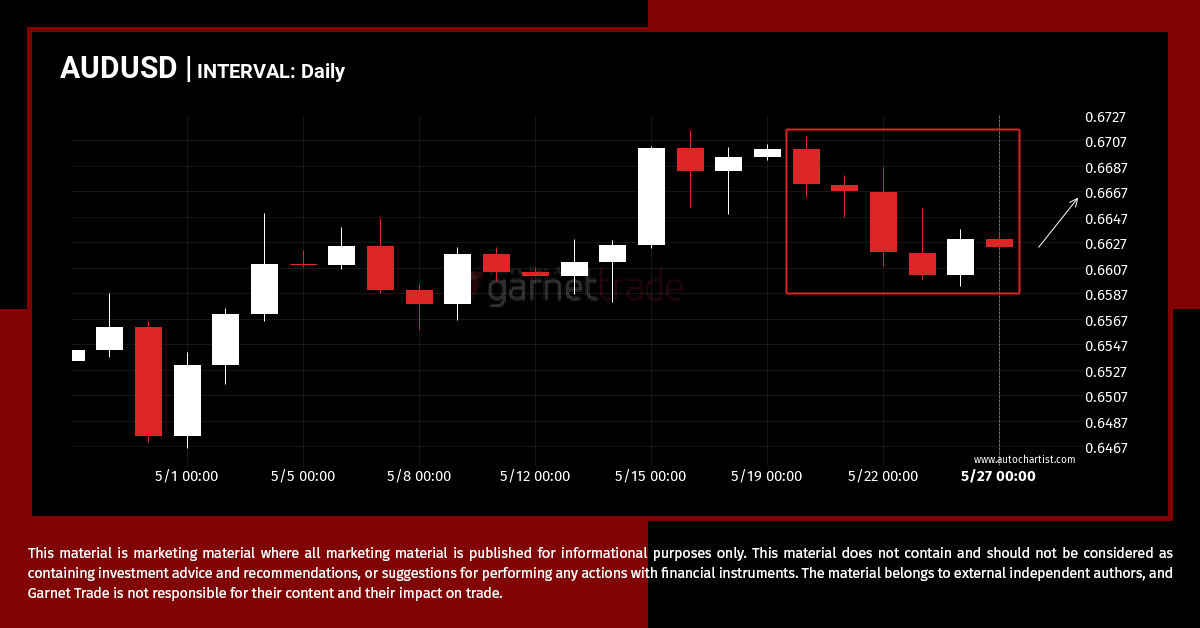
AUDUSD has experienced an unusual quantity of bearish candles on the Daily timeframe. This is in the 0.95 percentile of movements and so we could see a slight pullback over the next few candles.
A potential bearish movement on USDCAD
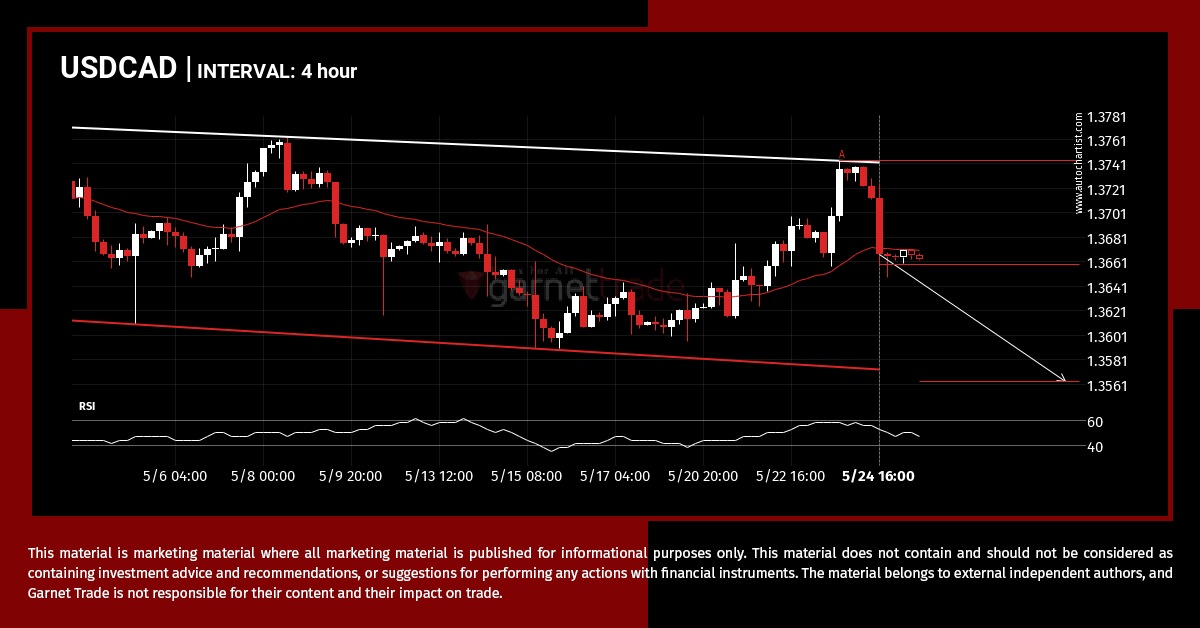
USDCAD was identified at around 1.36584 having recently rebounded of the resistance on the 4 hour data interval. Ultimately, the price action of the stock has formed a Channel Down pattern. This squeeze may increases the chances of a strong breakout. The projected movement will potentially take the price to around the 1.3563 level.
NDX.IND running upward for the last 23 days
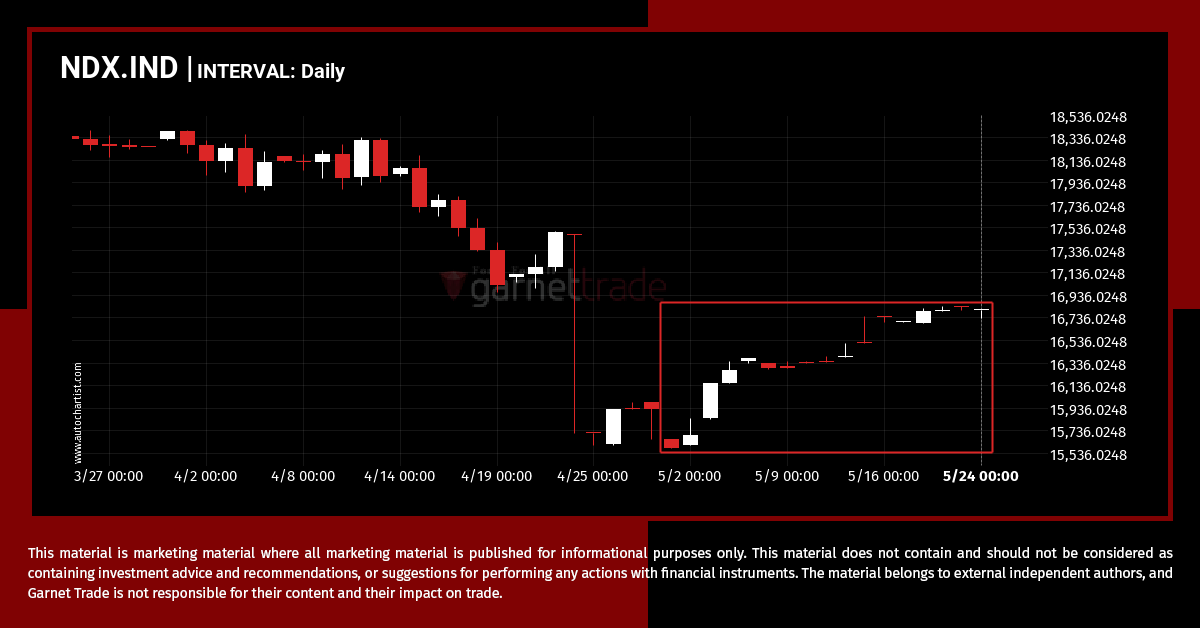
NDX.IND hits 16801.921 after a 7.83% move spanning 24 days.
Either a rebound or a breakout imminent on UKX.IND
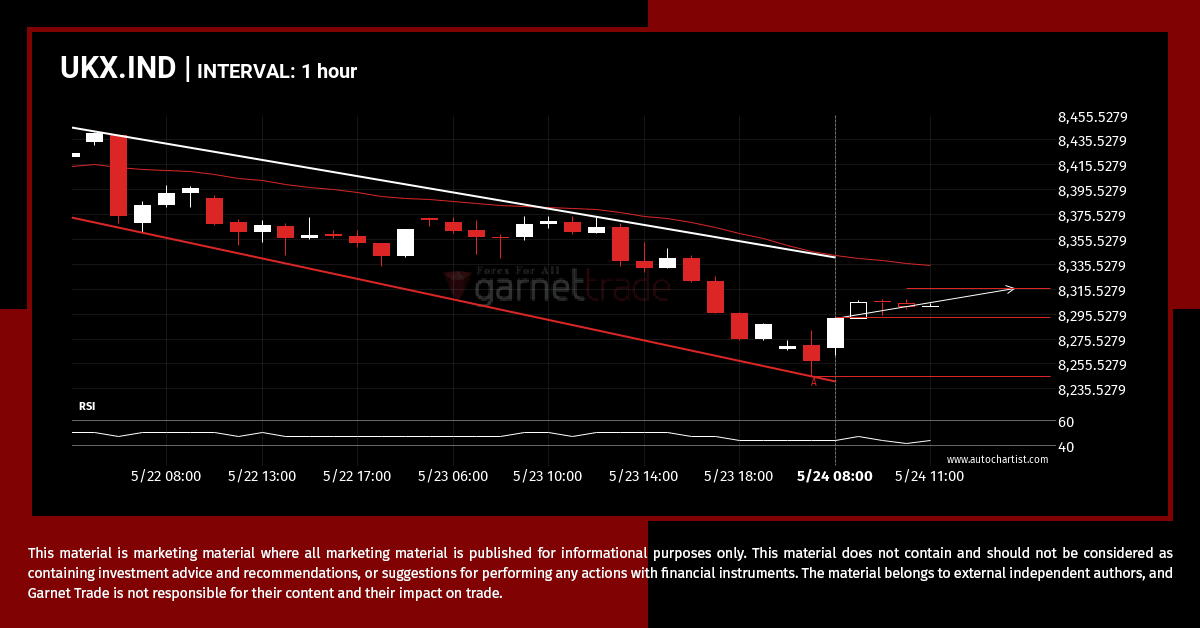
An emerging Flag has been detected on UKX.IND on the 1 hour chart. There is a possible move towards 8316.1750 next few candles. Once reaching support it may continue its bullish run or reverse back to current price levels.

