
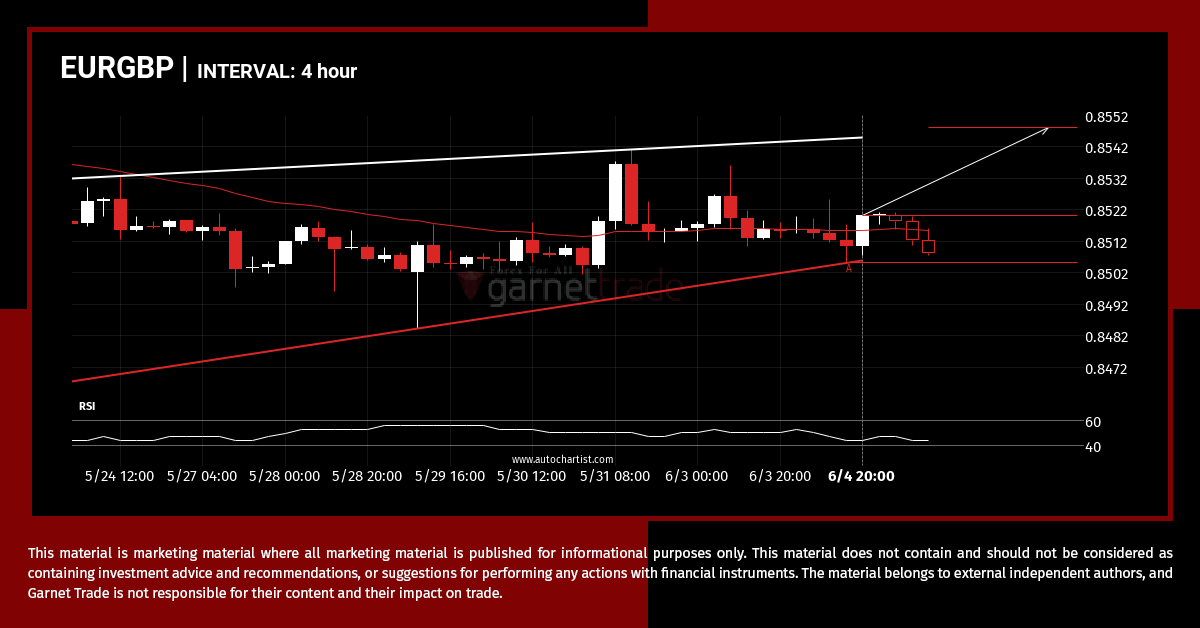
EURGBP – getting close to resistance of a Channel Up
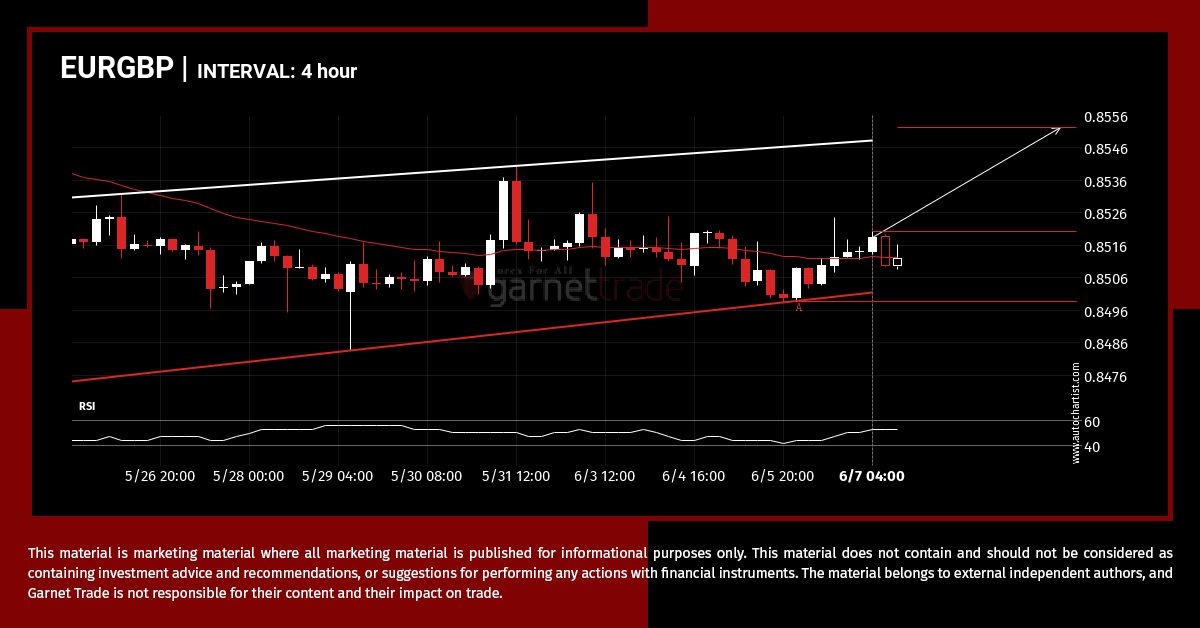
EURGBP is trapped in a Channel Up formation, implying that a breakout is Imminent. This is a great trade-setup for both trend and swing traders. It is now approaching a support line that has been tested in the past. Divergence opportunists may be very optimistic about a possible breakout and this may be the start […]
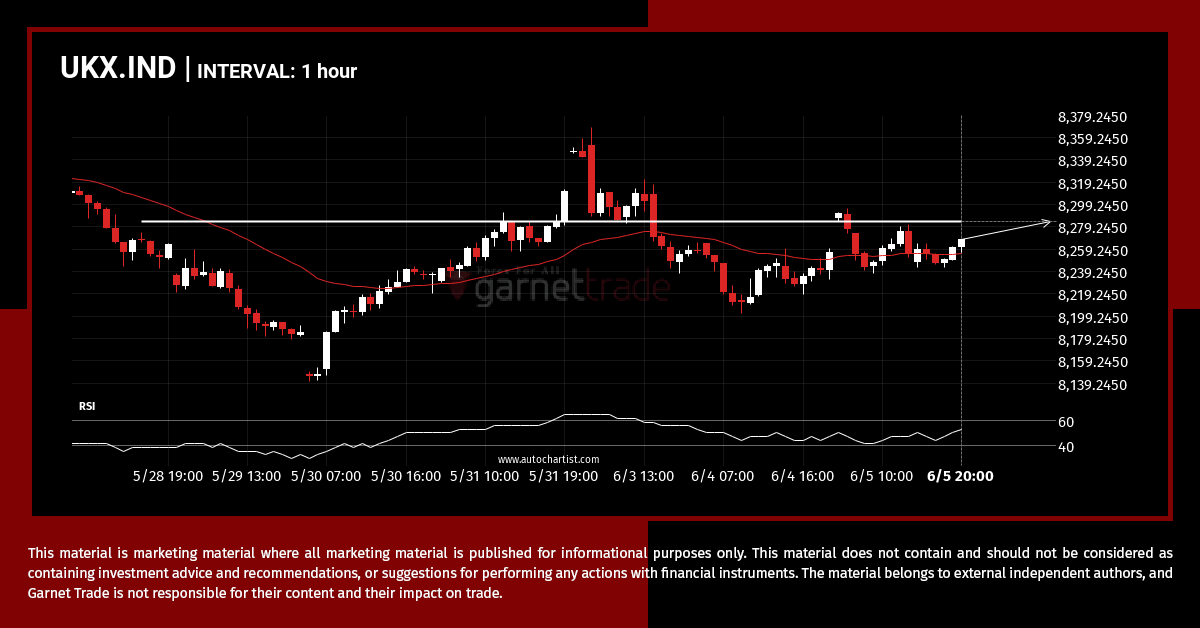
UKX.IND – psychological price line breached
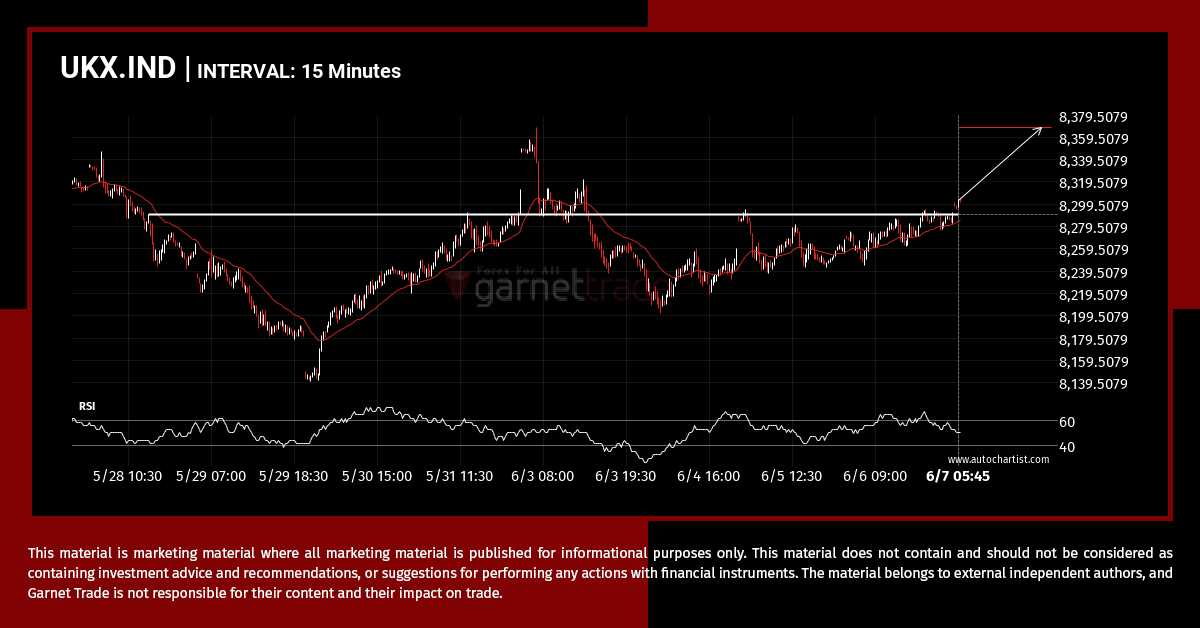
UKX.IND has broken through a line of 8290.4004 and suggests a possible movement to 8368.1504 within the next 2 days. It has tested this line numerous times in the past, so one should wait for a confirmation of this breakout before taking any action. If the breakout doesn’t confirm, we could see a retracement back […]
Possible breach of resistance level by EURUSD
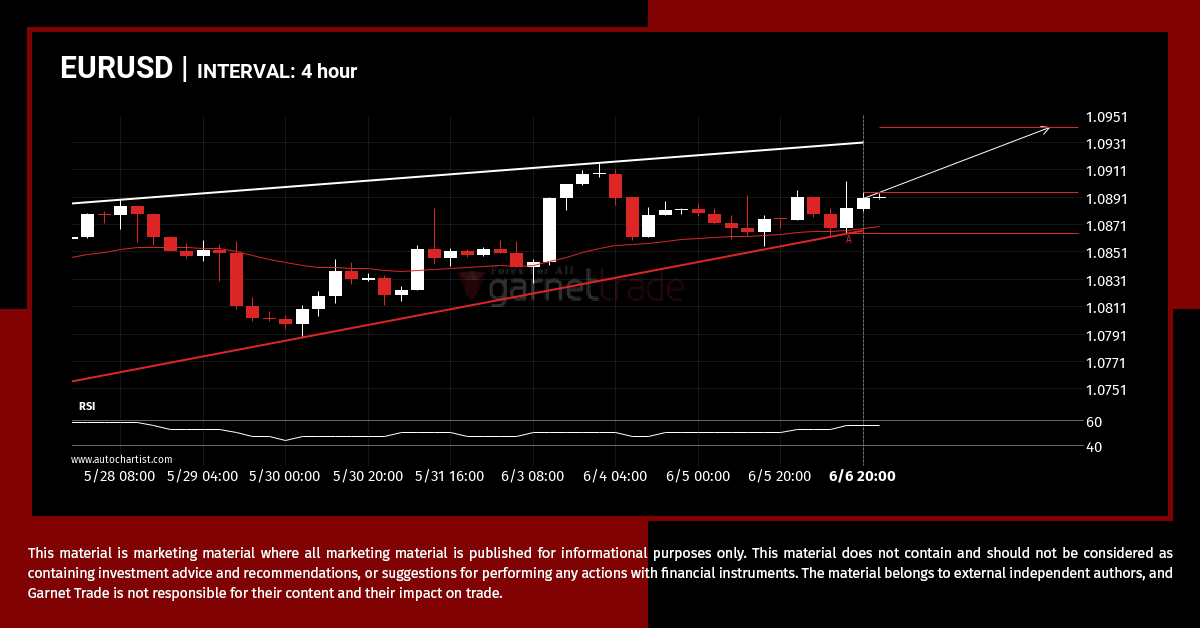
EURUSD is approaching the resistance line of a Rising Wedge. It has touched this line numerous times in the last 15 days. If it tests this line again, it should do so in the next 3 days.
AUDUSD approaching important bearish key level
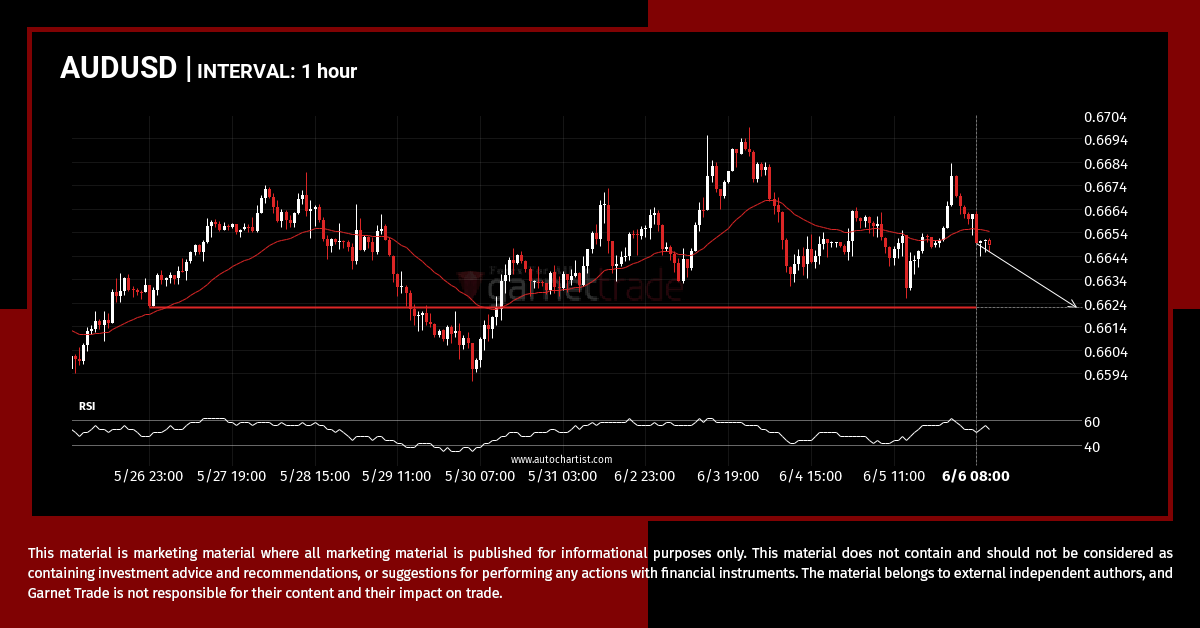
AUDUSD is approaching a support line at 0.6622. If it hits the support line, it may break through this level to continue the bearish trend, or it may turn around back to current levels.
A potential bullish movement on GBPUSD
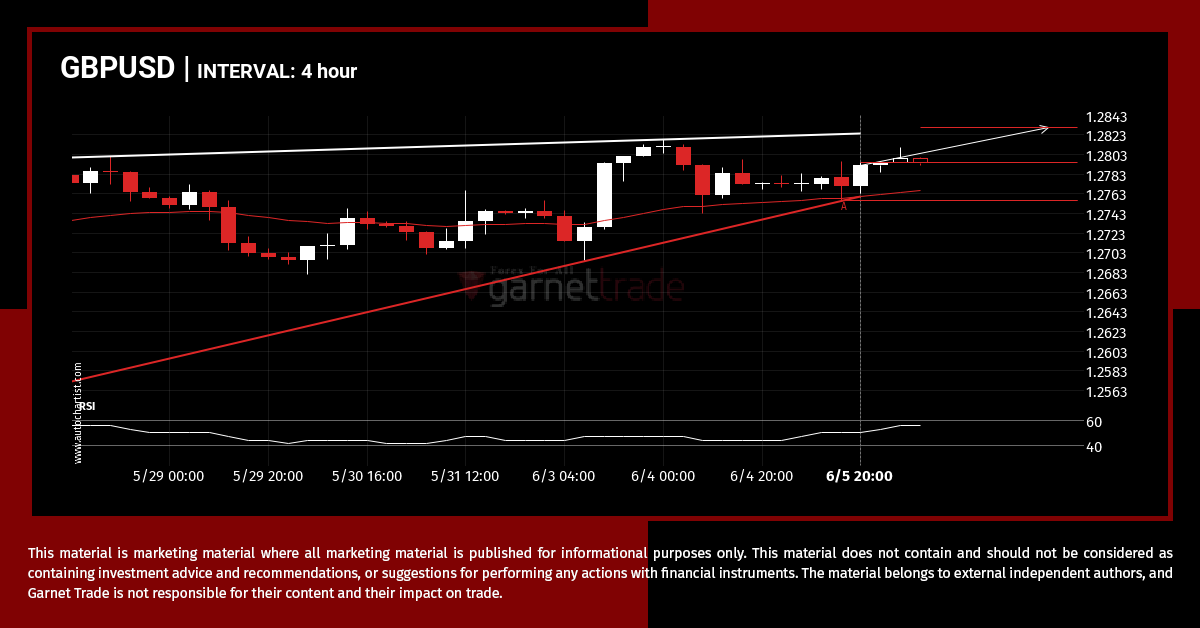
GBPUSD is heading towards the resistance line of a Rising Wedge. If this movement continues, the price of GBPUSD could test 1.2830 within the next 2 days. It has tested this line numerous times in the past, so this movement could be short-lived and end up rebounding just like it did in the past.
UKX.IND is on the approach
UKX.IND is moving towards a resistance line. Because we have seen it retrace from this level in the past, we could see either a break through this line, or a rebound back to current levels. It has touched this line numerous times in the last 9 days and may test it again within the next […]
EURGBP – Continuation Chart Pattern – Rising Wedge
EURGBP is moving towards a resistance line. Because we have seen it retrace from this line before, we could see either a break through this line, or a rebound back to current levels. It has touched this line numerous times in the last 13 days and may test it again within the next 2 days.
USDCHF experienced 5 consecutive daily bearish candles
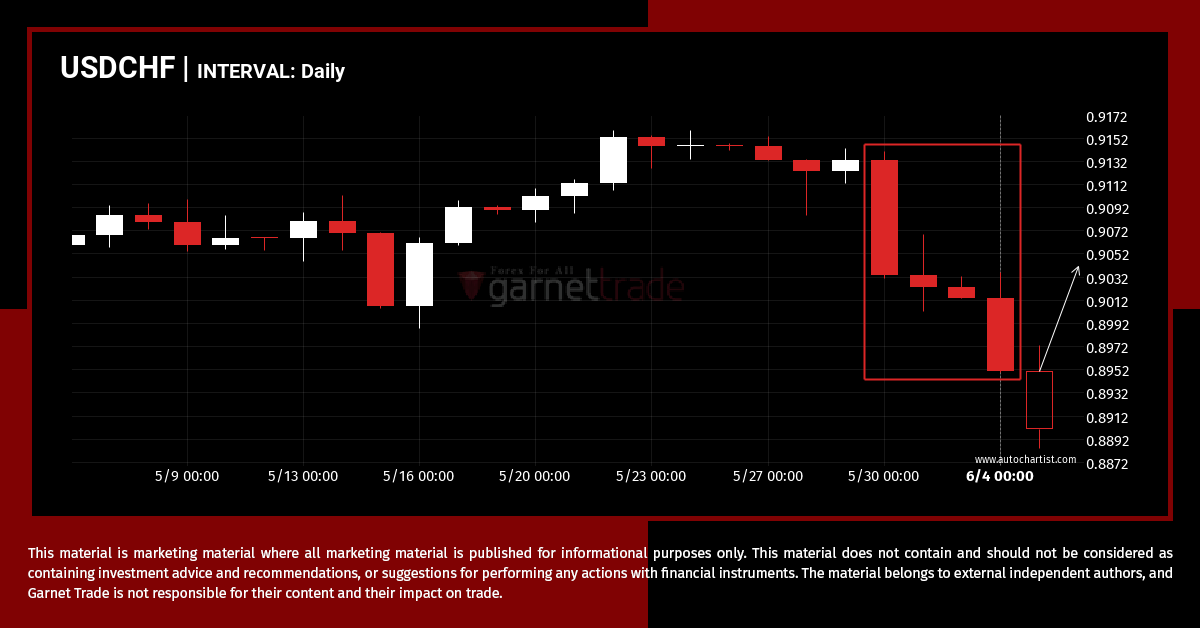
USDCHF has moved lower after 5 consecutive daily candles from 0.9133 to 0.8951 in the last 6 days.
Should we expect a breakout or a rebound on UKX.IND?
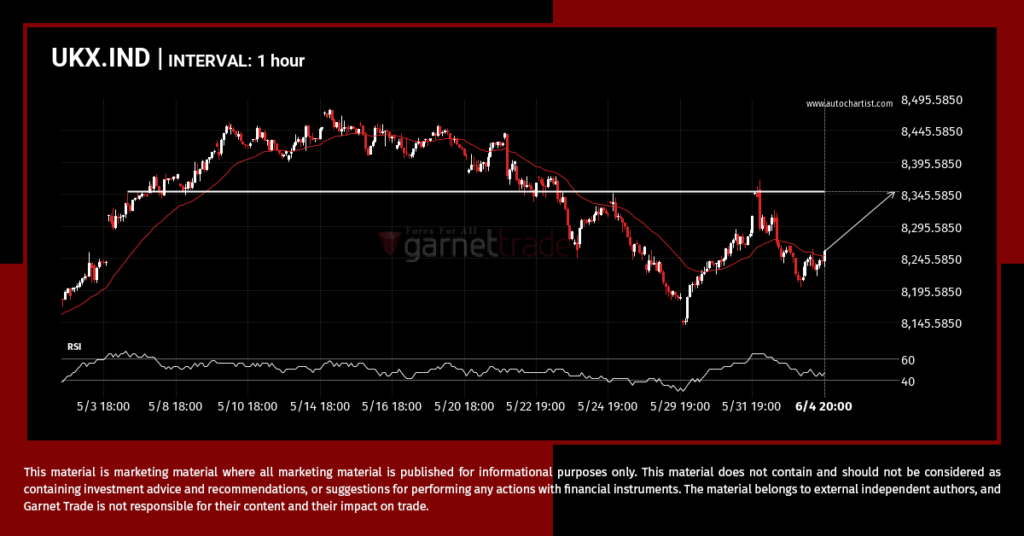
The price of UKX.IND in heading back to the resistance area. It is possible that it will struggle to break through it and move back in the other direction. The price may eventually break through, but typically the price retreats from the level a number of times before doing so.
What’s going on with XAGUSD?
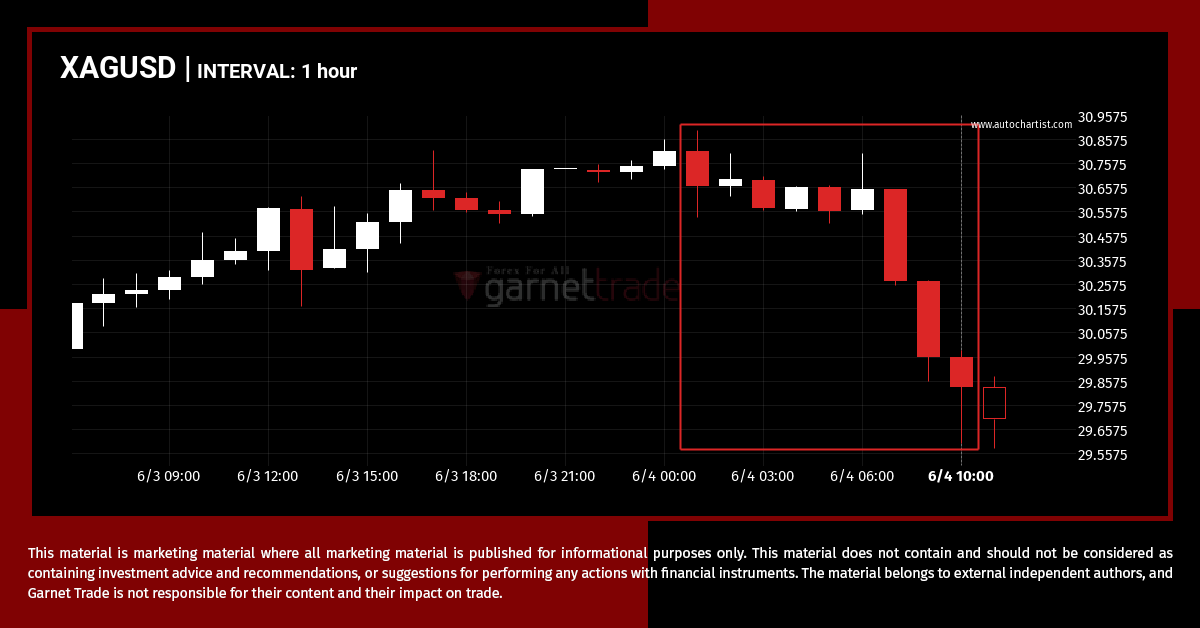
XAGUSD has moved lower by 2.47% from 30.568 to 29.813 in the last 9 hours.