
Confirmed breakout on USDCHF 4 hour chart
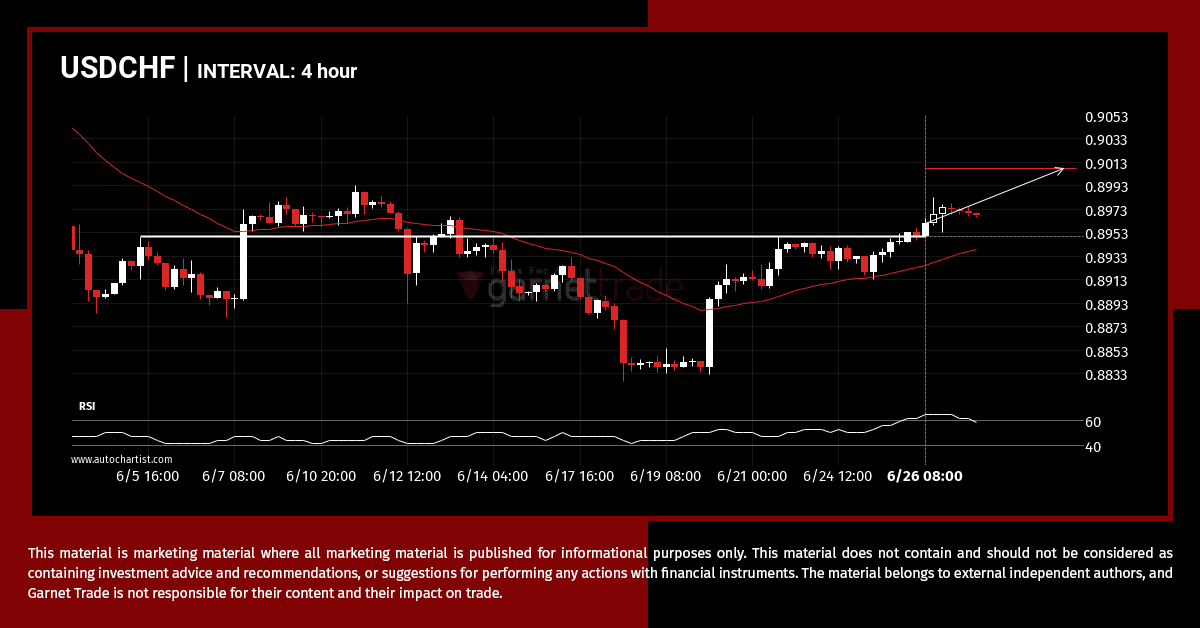
USDCHF has broken through a resistance line. Because we have seen it retrace from this price in the past, one should wait for confirmation of the breakout before trading. It has touched this line numerous times in the last 21 days and suggests a possible target level to be around 0.9008 within the next 3 […]
Should we expect a breakout or a rebound on XAGUSD?
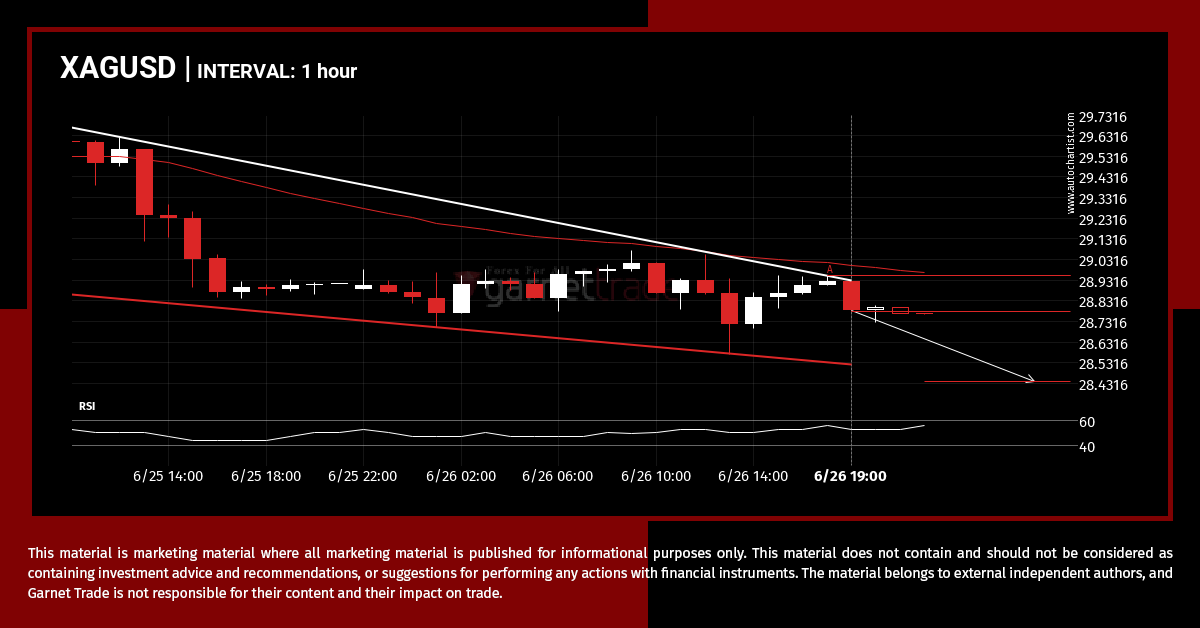
XAGUSD is heading towards the support line of a Falling Wedge and could reach this point within the next 6 hours. It has tested this line numerous times in the past, and this time could be no different from the past, ending in a rebound instead of a breakout. If the breakout doesn’t happen, we […]
GBPUSD – Continuation Chart Pattern – Channel Down
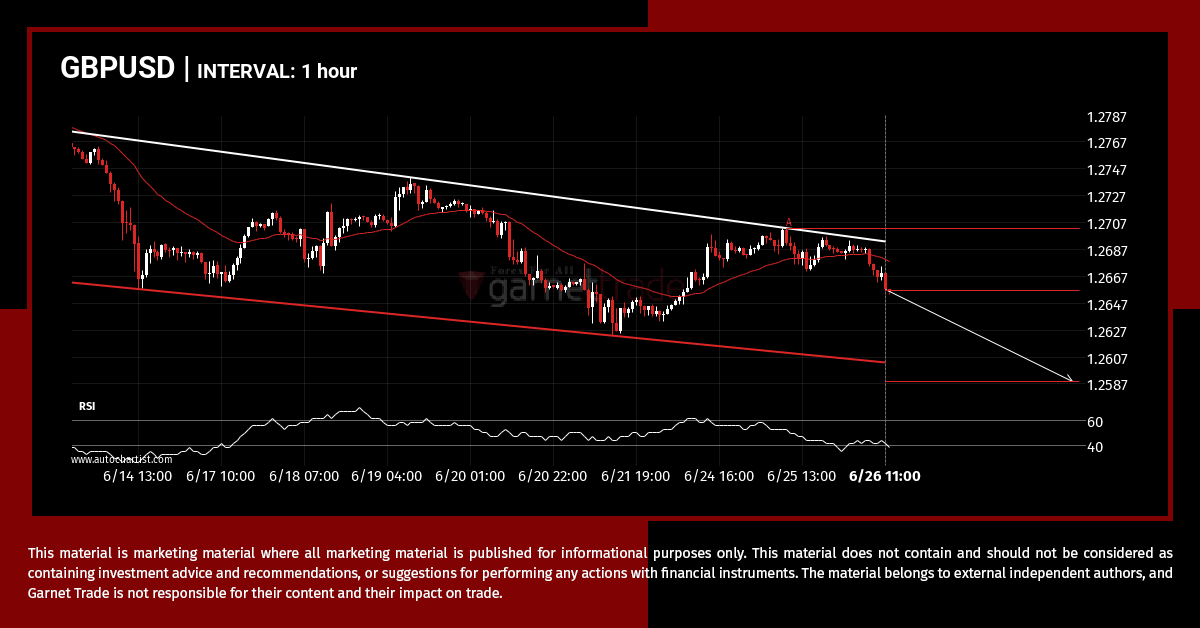
The movement of GBPUSD towards the support line of a Channel Down is yet another test of the line it reached numerous times in the past. This line test could happen in the next 3 days, but it is uncertain whether it will result in a breakout through this line, or simply rebound back to […]
Confirmed breakout on SPX.IND 1 hour chart
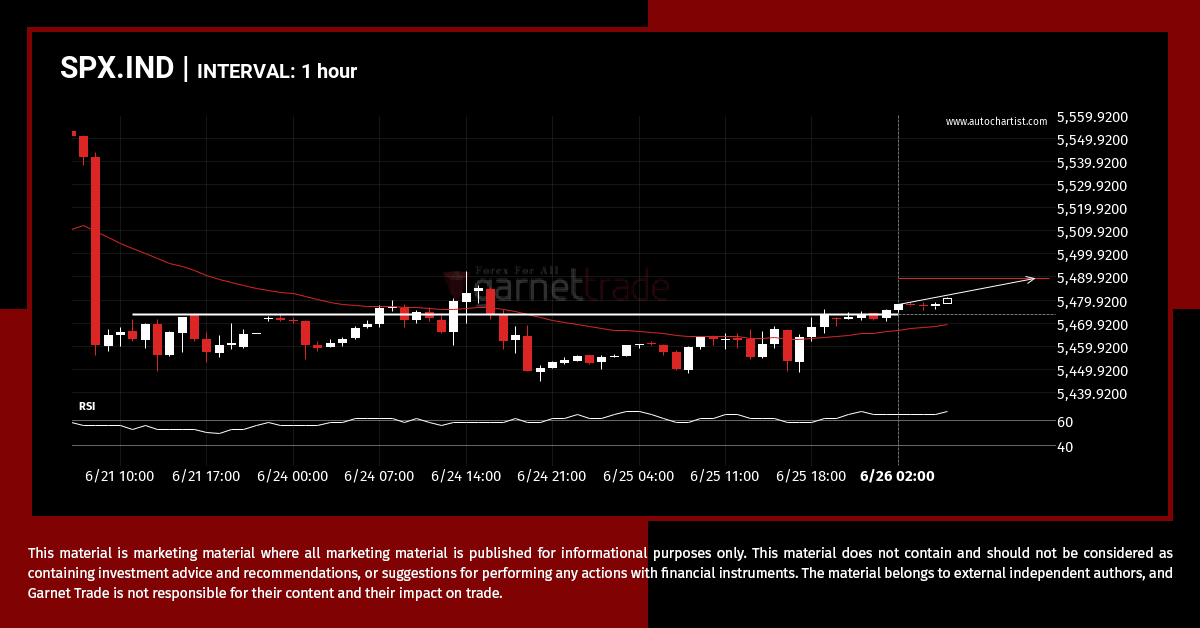
The price of SPX.IND in heading in the direction of 5489.4248. Despite the recent breakout through 5473.5000 it is possible that it will struggle to gain momentum to the forecast price and move back in the other direction. This has happened many times in the past so watch for a possible bounce back.
Should we expect a breakout or a rebound on AUDUSD?
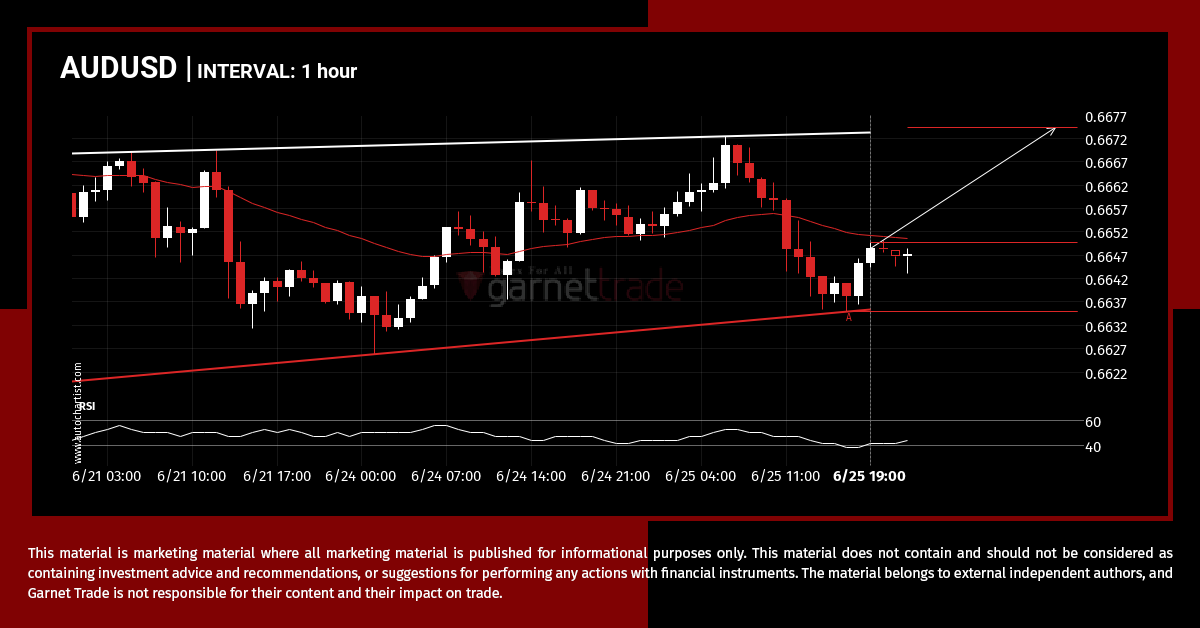
Emerging Ascending Triangle pattern in its final wave was identified on the AUDUSD 1 hour chart. After a strong bullish run, we find AUDUSD heading towards the upper triangle line with a possible resistance at 0.6675. If the resistance shows to hold, the Ascending Triangle pattern suggests a rebound back towards current levels.
DAX.IND breakout through support
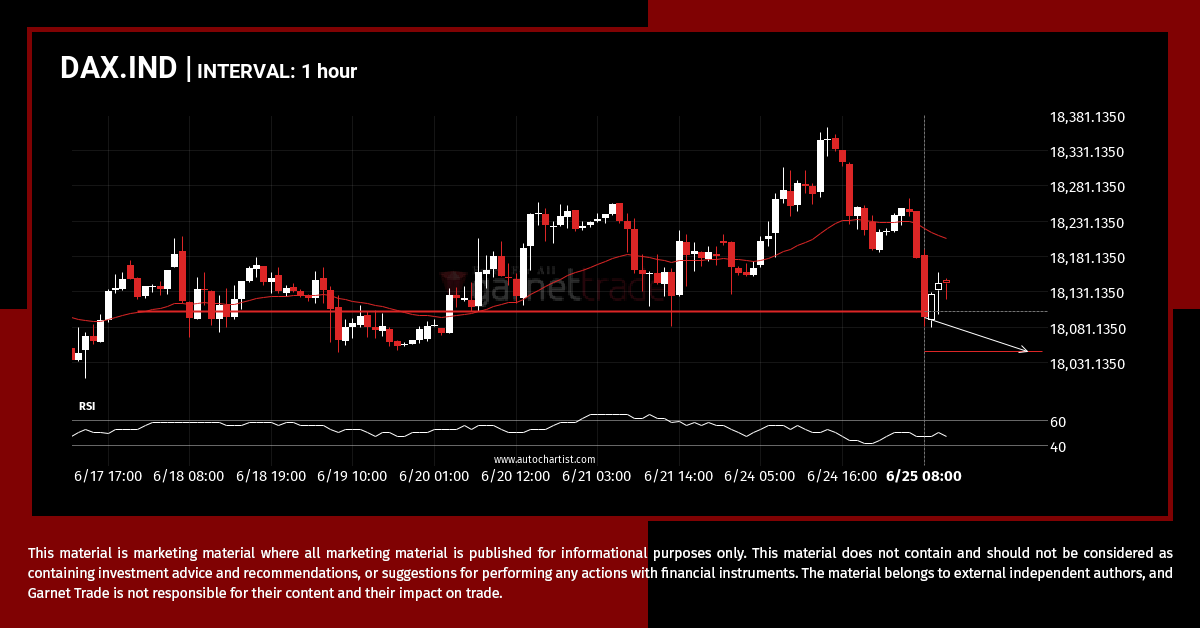
DAX.IND has breached the support line at 18103.0000. It may continue the bearish trend towards 18046.8301, or, it may prove to be yet another test of this level.
A potential bearish movement on XAUUSD
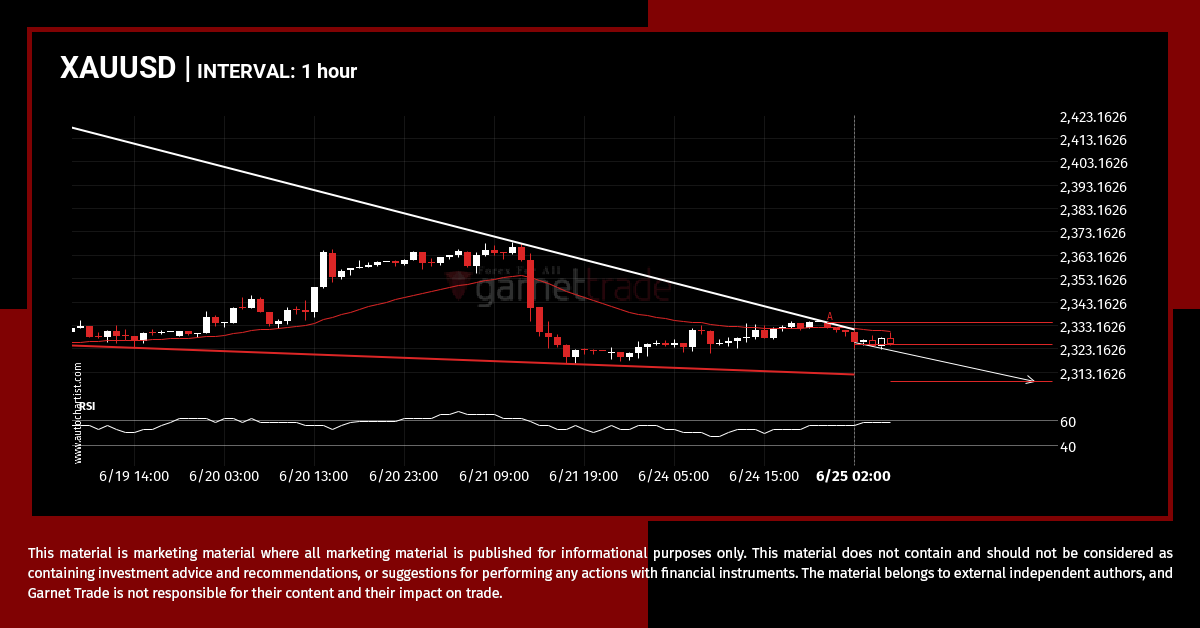
The movement of XAUUSD towards the support line of a Falling Wedge is yet another test of the line it reached numerous times in the past. This line test could happen in the next 22 hours, but it is uncertain whether it will result in a breakout through this line, or simply rebound back to […]
SPX.IND – support line broken at 2024-06-24T22:00:00.000Z
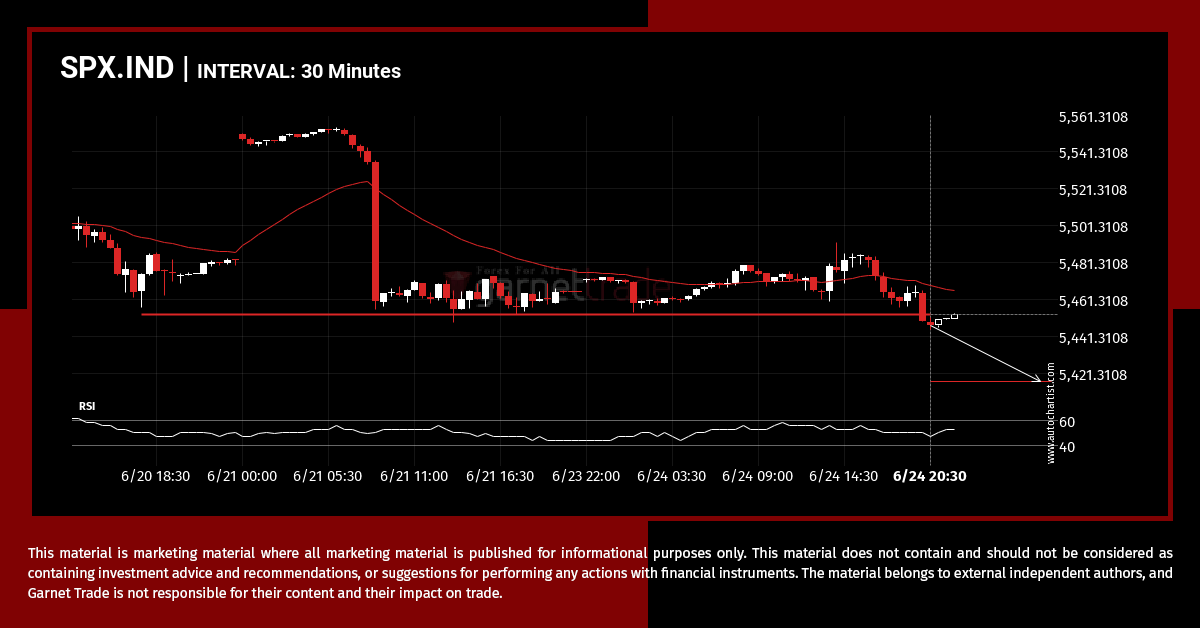
The price of SPX.IND in heading in the direction of 5417.0249. Despite the recent breakout through 5452.9902 it is possible that it will struggle to gain momentum to the forecast price and move back in the other direction. This has happened many times in the past so watch for a possible bounce back.
Confirmed breakout on EURGBP 1 hour chart
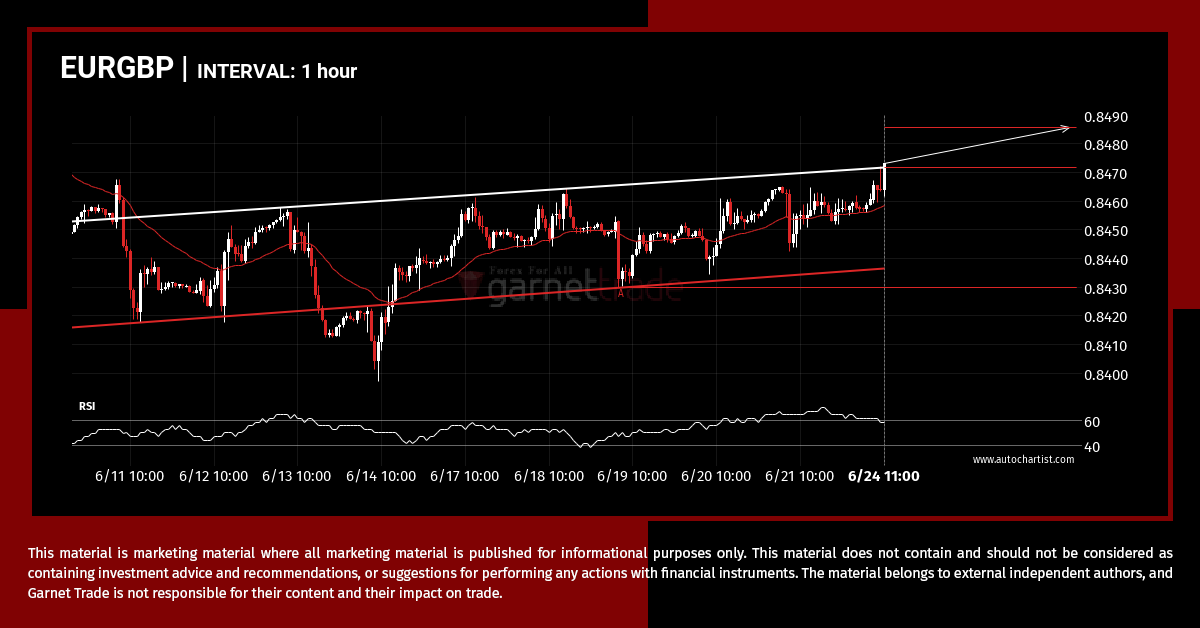
The last 18 1 hour candles on EURGBP formed a Inverse Head and Shoulders pattern and broken out through the pattern lines, indicating a possible bullish movement towards the price level of 0.8486.
DAX.IND approaches important level of 18257.9004
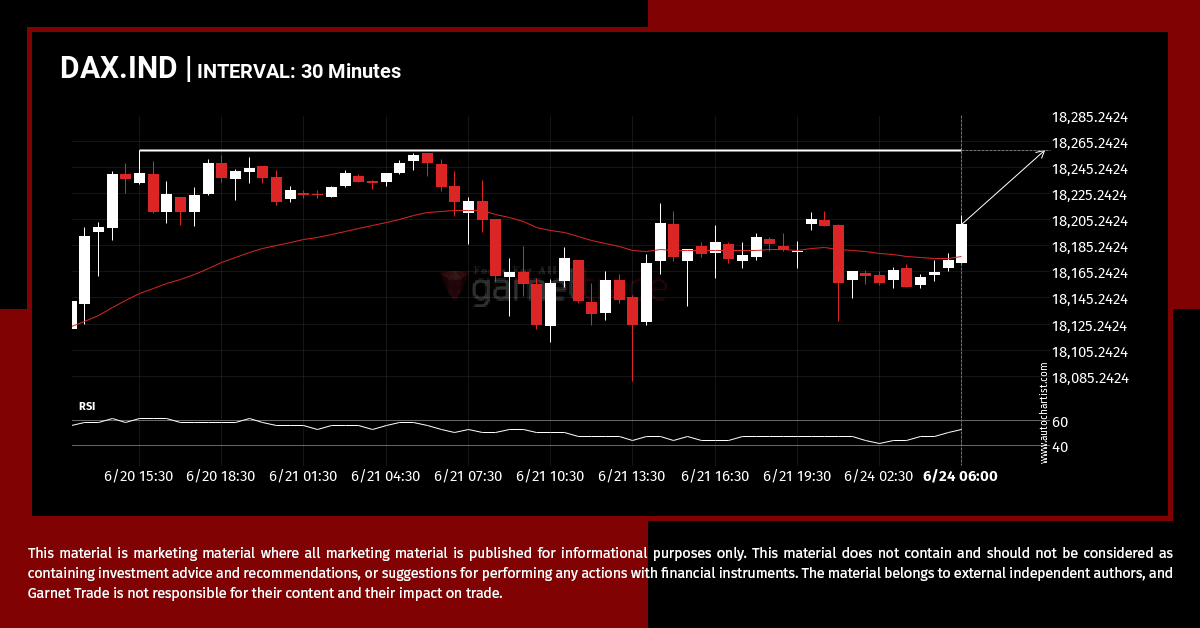
A strong resistance level has been identified at 18257.9004 on the 30 Minutes DAX.IND chart. DAX.IND is likely to test it soon.