USDCHF – getting close to psychological price line
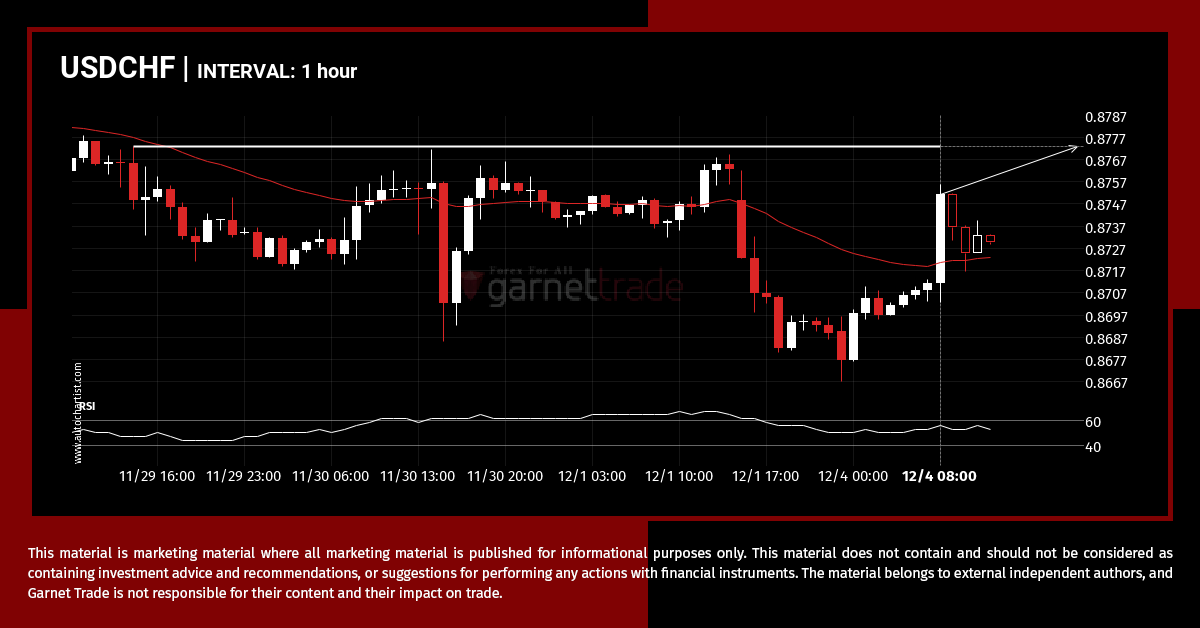
USDCHF is en route to a very important line that will be a definite deciding factor of what is to come! We may see this trajectory continue to touch and break through 0.8772, unless it runs out of momentum and pulls back to current levels.
Will UKX.IND have enough momentum to break support?
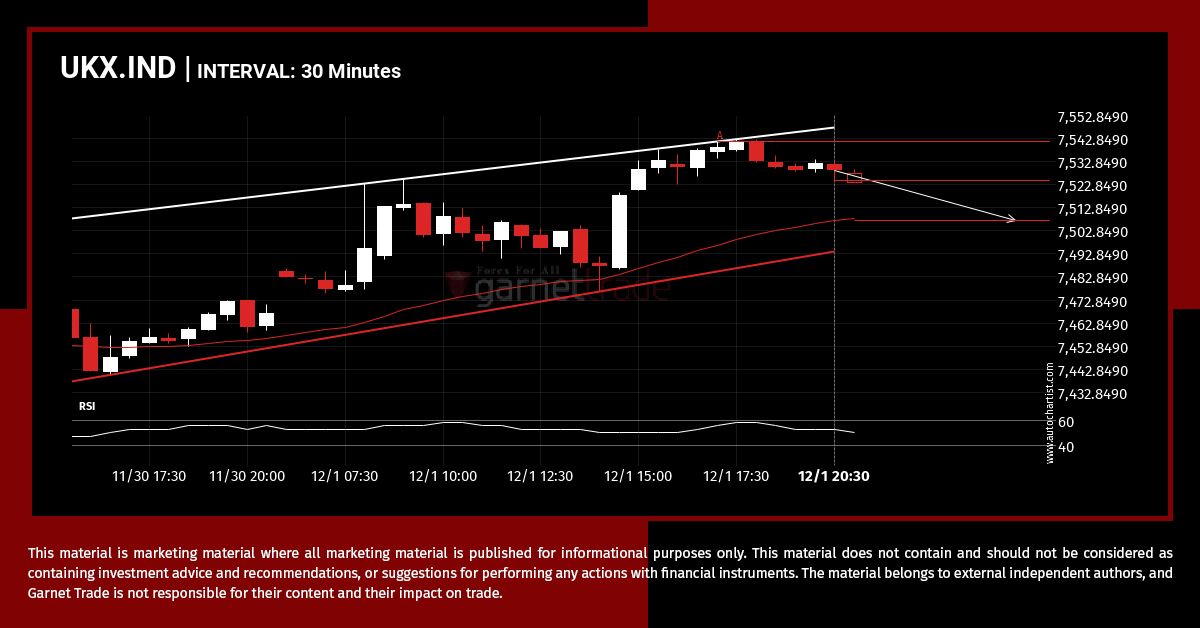
UKX.IND was identified at around 7524.6 having recently rebounded of the resistance on the 30 Minutes data interval. Ultimately, the price action of the stock has formed a Channel Up pattern. This squeeze may increases the chances of a strong breakout. The projected movement will potentially take the price to around the 7507.2000 level.
A 8 hours run-downward on XAUUSD
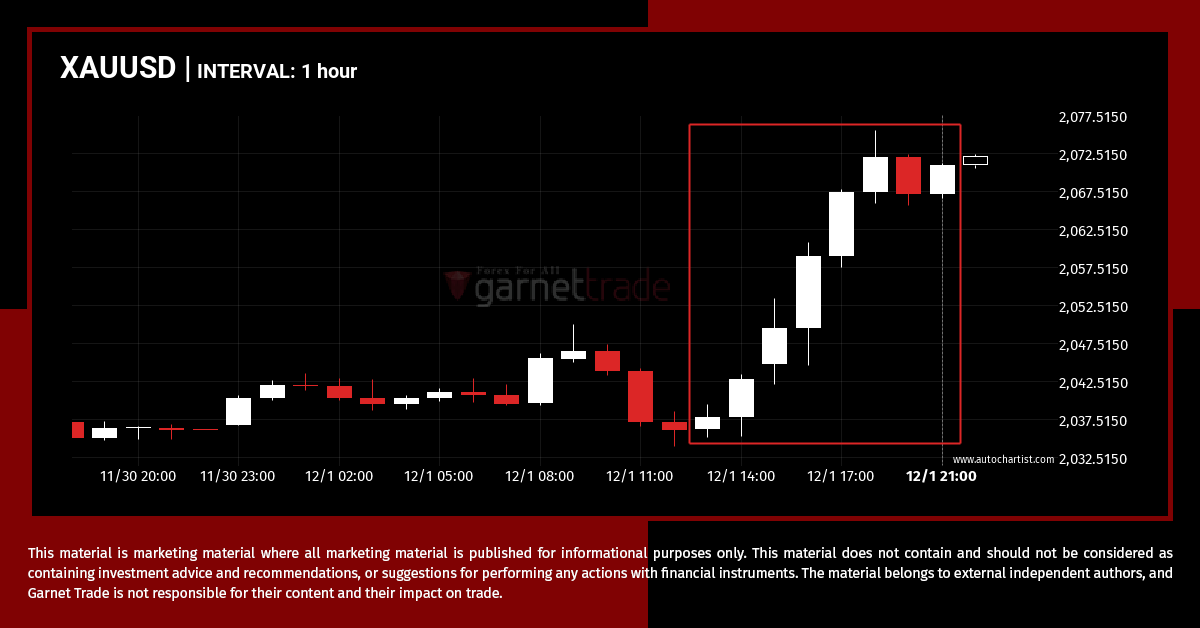
A movement of 1.59% over 8 hours on XAUUSD doesn’t go unnoticed. You may start considering where it’s heading next, a continuation of the current upward trend, or a reversal in the previous direction.
bearish technical pattern on XAGUSD 30 Minutes
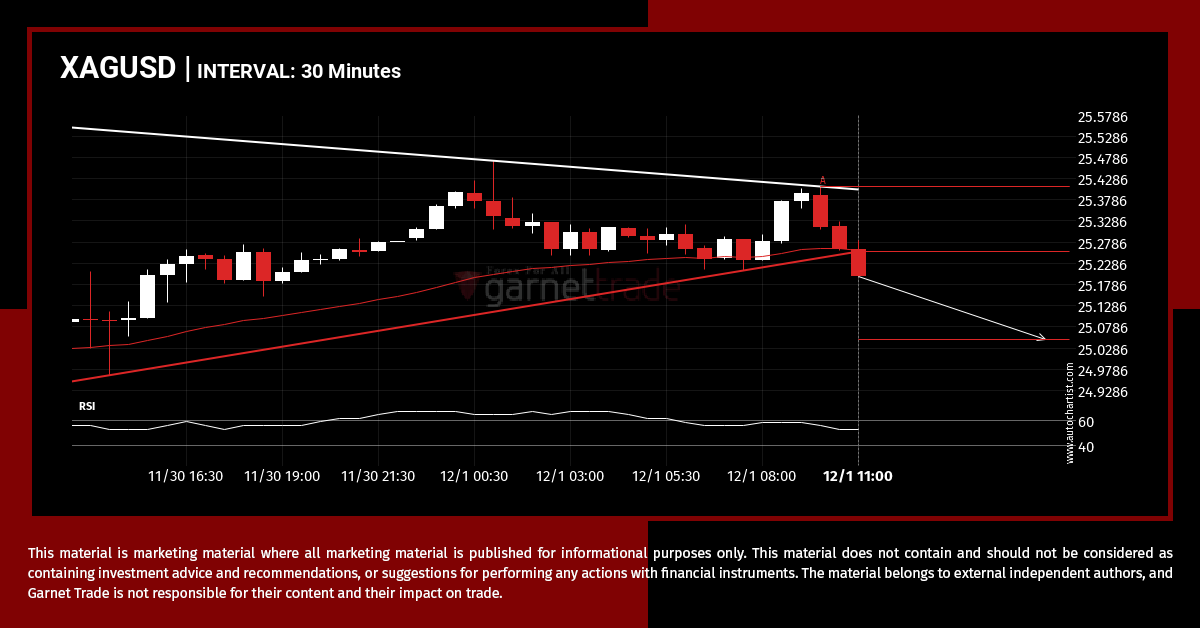
XAGUSD has broken through the support line of a Triangle technical chart pattern. Because we have seen it retrace from this line in the past, one should wait for confirmation of the breakout before taking any action. It has touched this line twice in the last 2 days and suggests a possible target level to […]
Did you miss this move on GBPUSD?
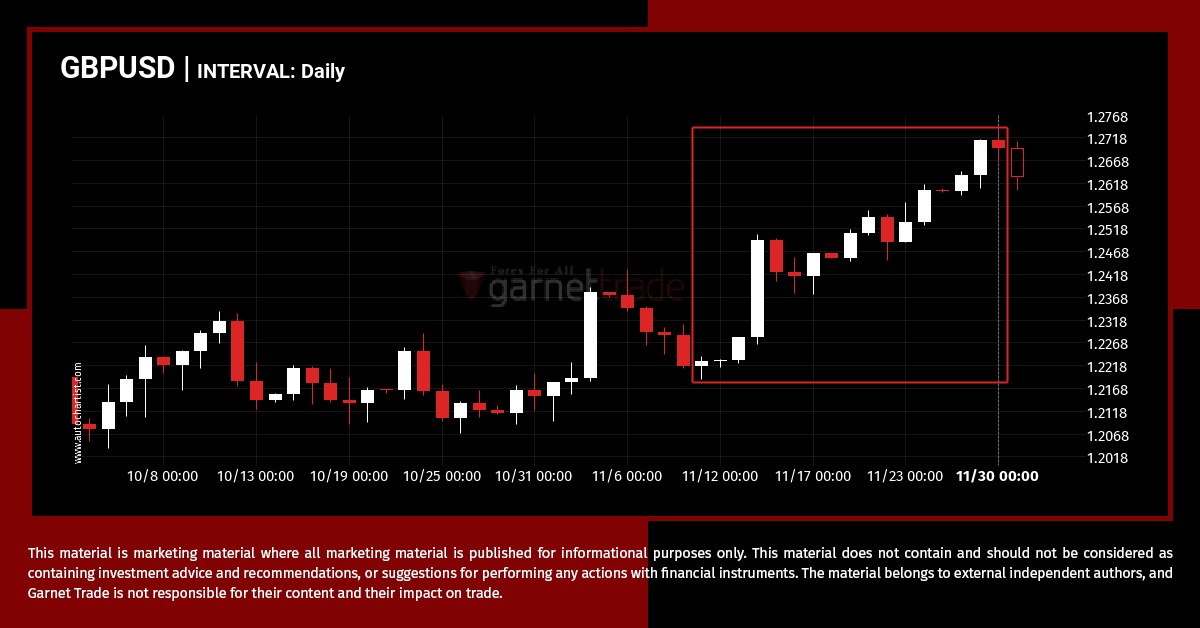
GBPUSD has moved higher by 3.83% from 1.22273 to 1.2695 in the last 21 days.
A potential bearish movement on UKX.IND
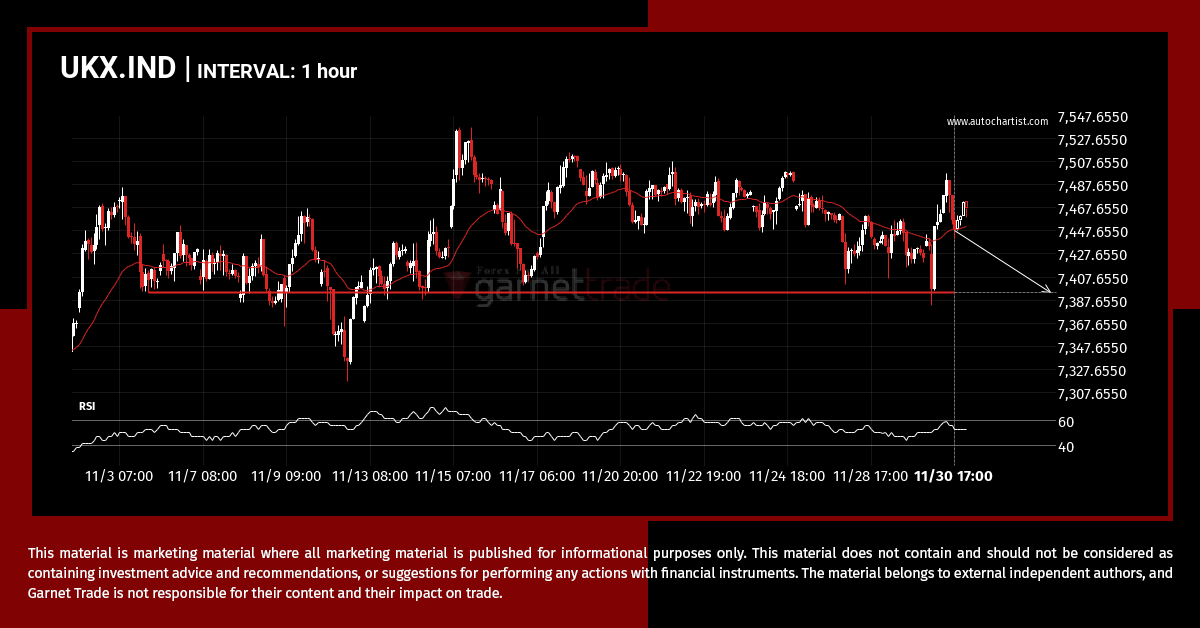
UKX.IND is moving towards a key support level at 7394.1001. UKX.IND has previously tested this level 5 times and on each occasion it has bounced back off this level. Is this finally the time it will break through?
Possible breach of resistance level by DAX.IND
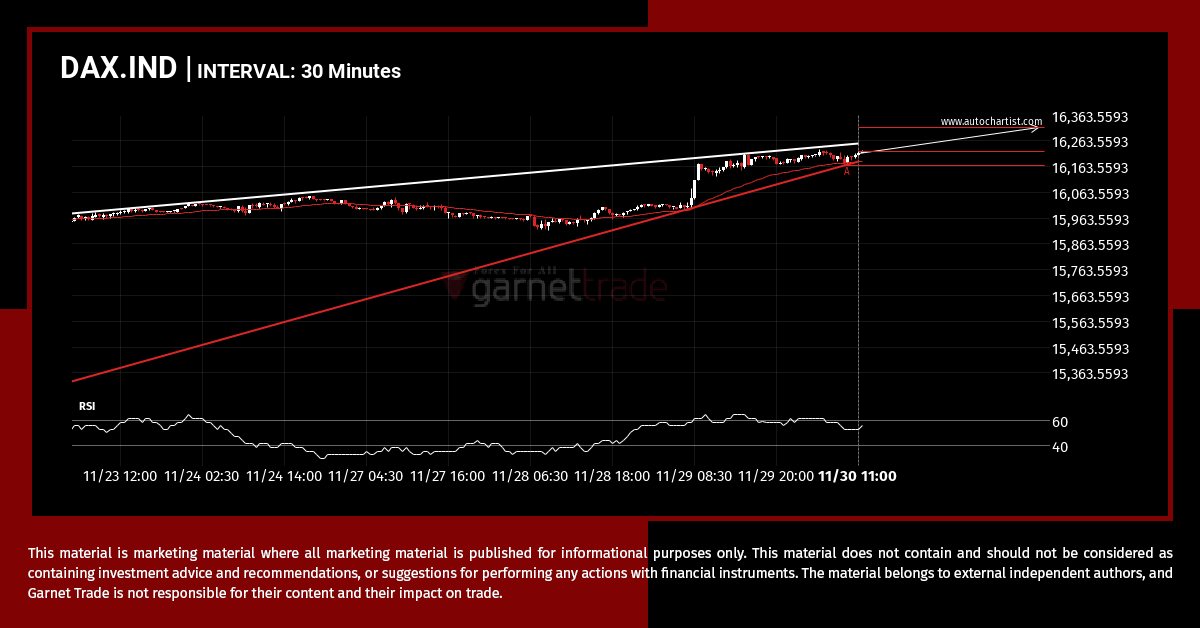
DAX.IND is heading towards the resistance line of a Rising Wedge. If this movement continues, the price of DAX.IND could test 16314.3985 within the next 2 days. It has tested this line numerous times in the past, so this movement could be short-lived and end up rebounding just like it did in the past.
SPX.IND is on its way up
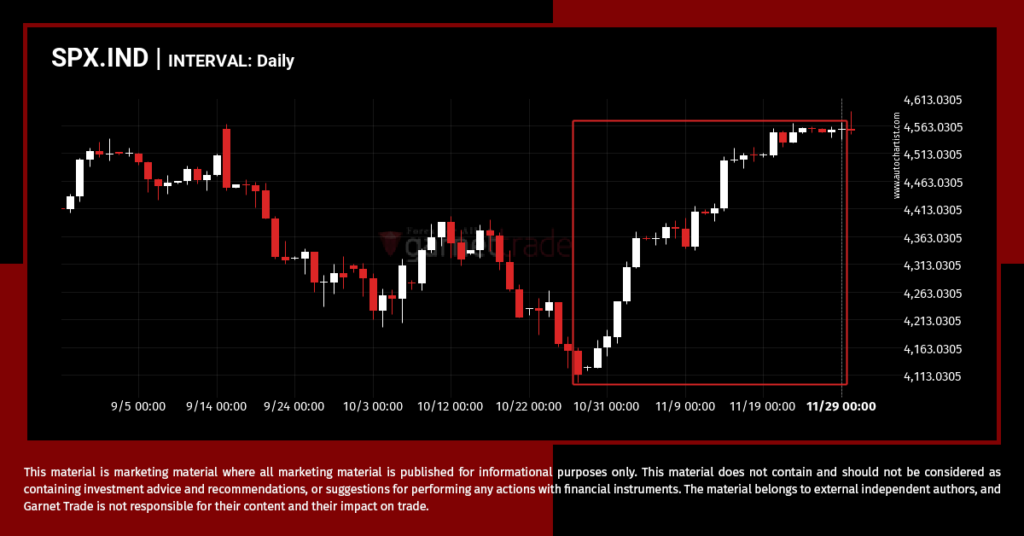
An unexpected large move has occurred on SPX.IND Daily chart beginning at 4113.87 and ending at 4555.92. Is this a sign of something new? What can we expect in the future?
Breach of important price line imminent by NDX.IND
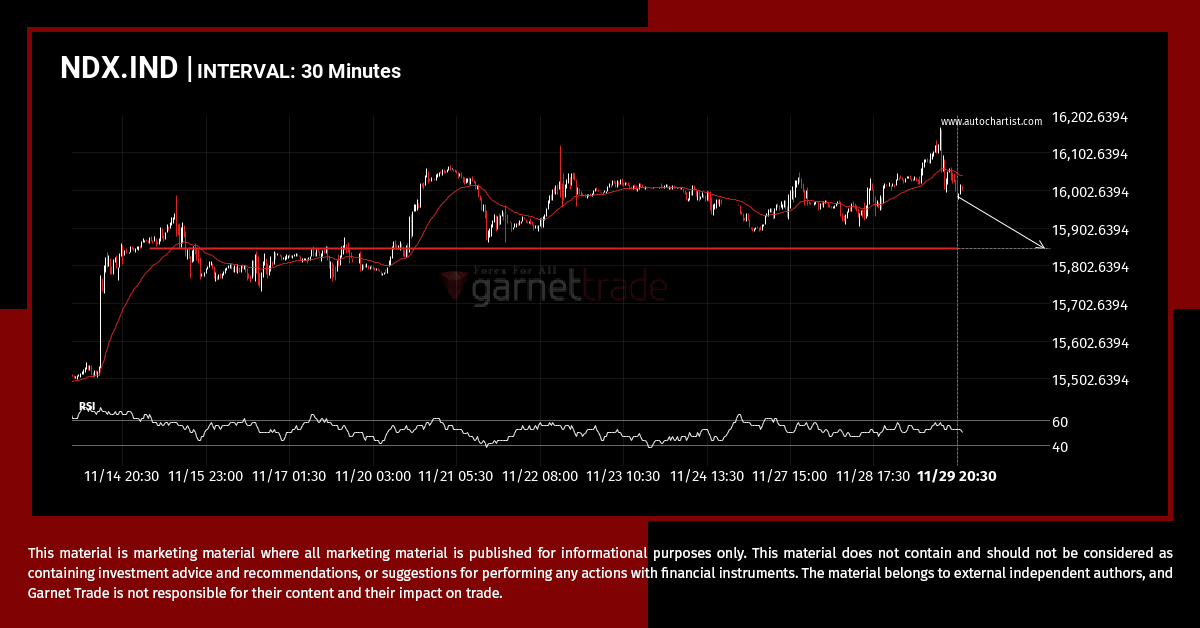
NDX.IND is moving towards a key support level at 15848.2598. NDX.IND has previously tested this level 5 times and on each occasion it has bounced back off this level. Is this finally the time it will break through?
USDCHF experienced 5 consecutive daily bearish candles
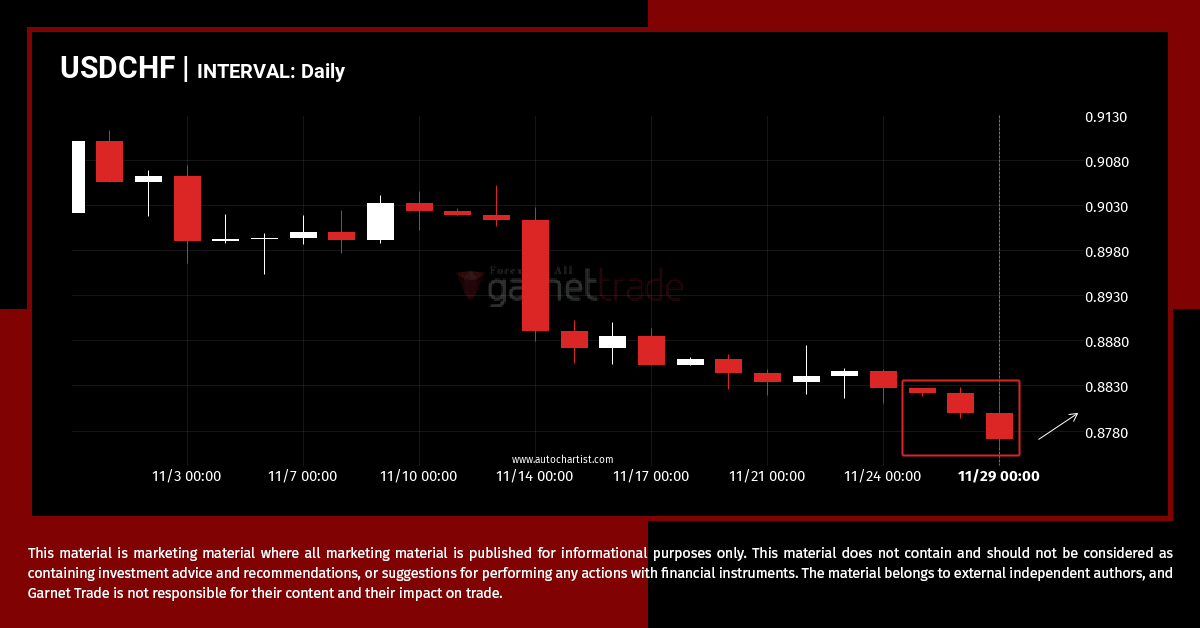
USDCHF has moved lower after 5 consecutive daily candles from 0.8828 to 0.8771 in the last 4 days.

