Either a rebound or a breakout imminent on XAGUSD
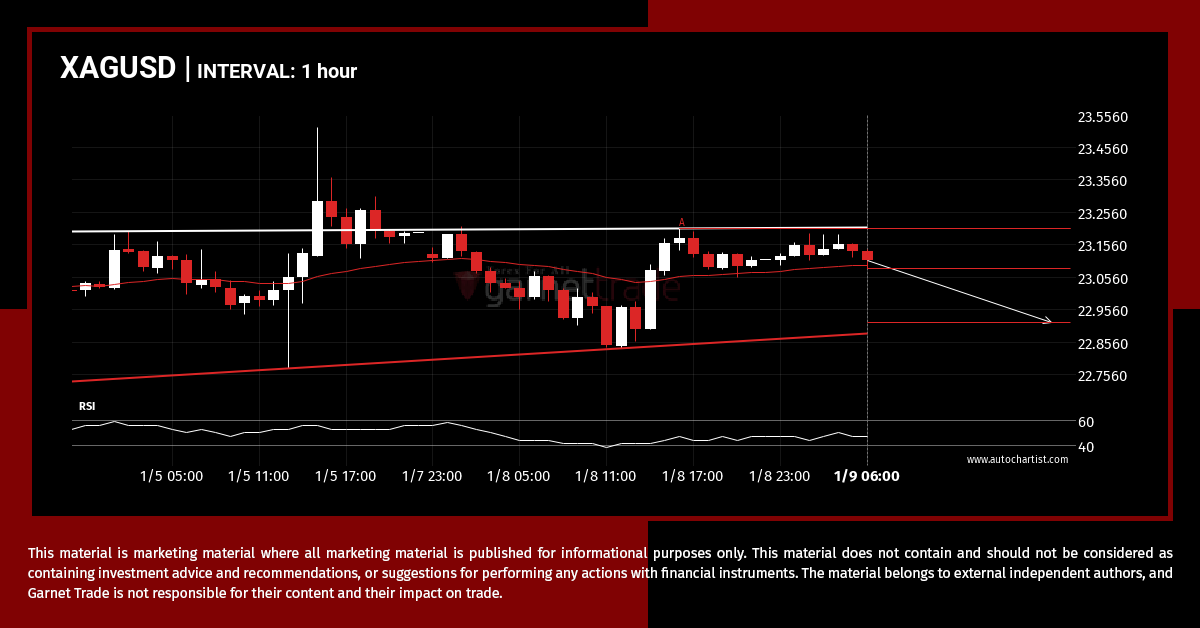
A Head and Shoulders pattern was identified on XAGUSD at 23.083, creating an expectation that it may move to the support line at 22.9159. It may break through that line and continue the bearish trend or it may reverse from that line.
SPX.IND experienced an exceptionally large movement
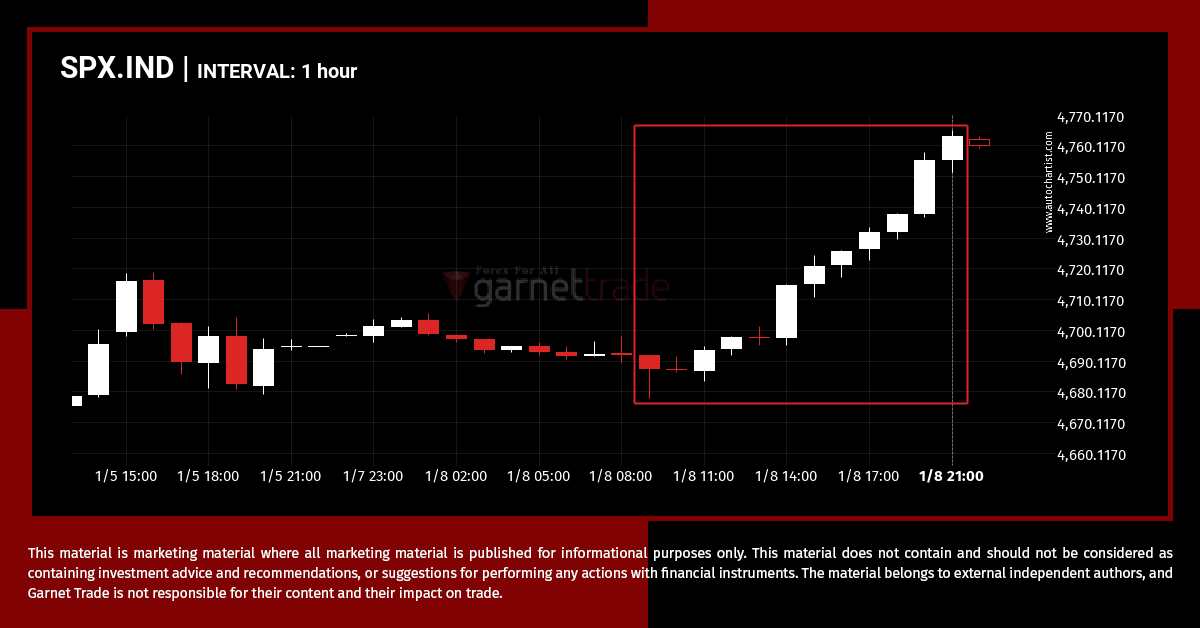
For those of you that don’t believe in trends, this may be an opportunity to take advantage of an exceptional 1.61% move on SPX.IND. The movement has happened over the last 12 hours. For those trend followers among you, you may think about riding this possible trend.
Should we expect a bearish trend on EURUSD?
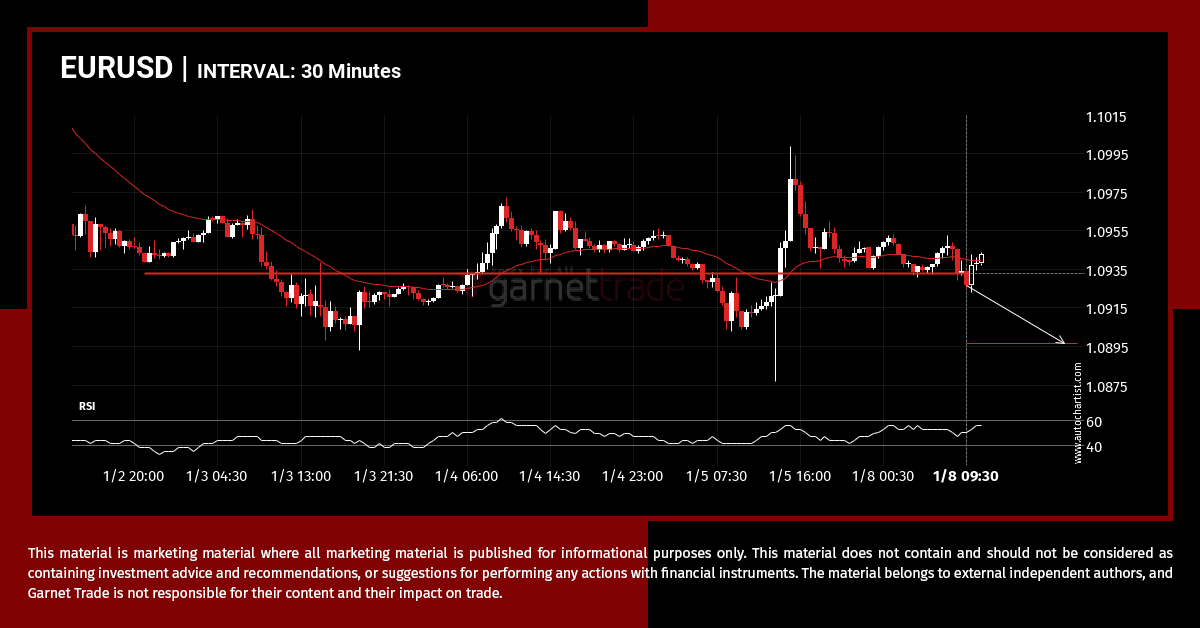
EURUSD has broken through a support line. Because we have seen it retrace from this price in the past, one should wait for confirmation of the breakout before trading. It has touched this line numerous times in the last 6 days and suggests a possible target level to be around 1.0896 within the next 19 […]
Should we expect a breakout or a rebound on XAGUSD?
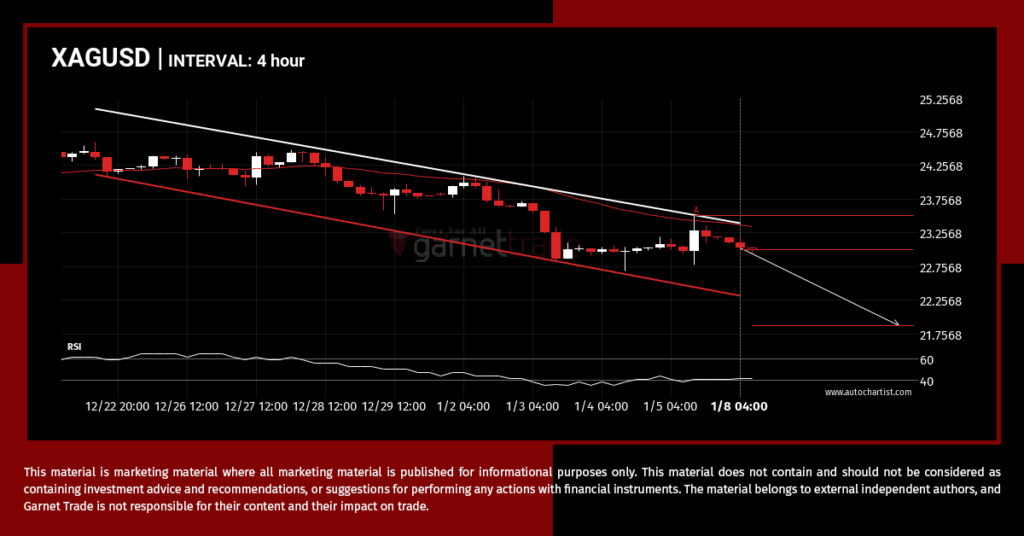
Emerging Channel Down detected on XAGUSD – the pattern is an emerging one and has not yet broken through resistance, but the price is expected to move up over the next few hours. The price at the time the pattern was found was 23.011 and it is expected to move to 21.8842.
DAX.IND is on the approach
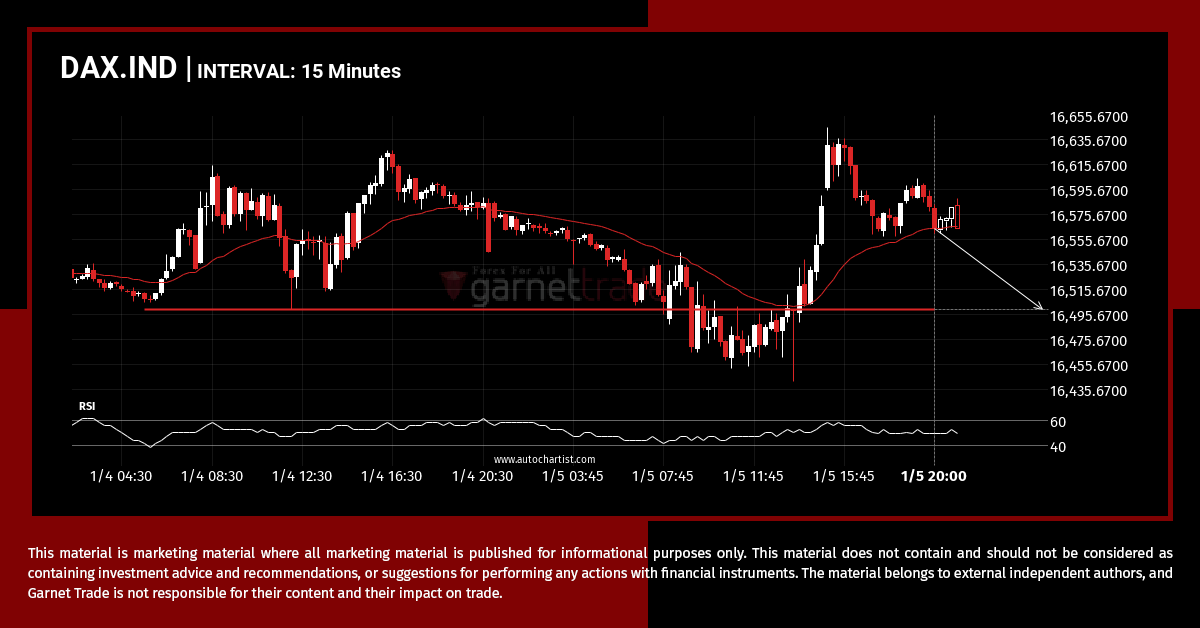
DAX.IND is moving towards a key support level at 16500.0000. This is a previously tested level for DAX.IND. This could be a good trading opportunity, either at the spot price, or after breaching this level.
Recent bearish run on AUDUSD. Continuation or reversal to follow?
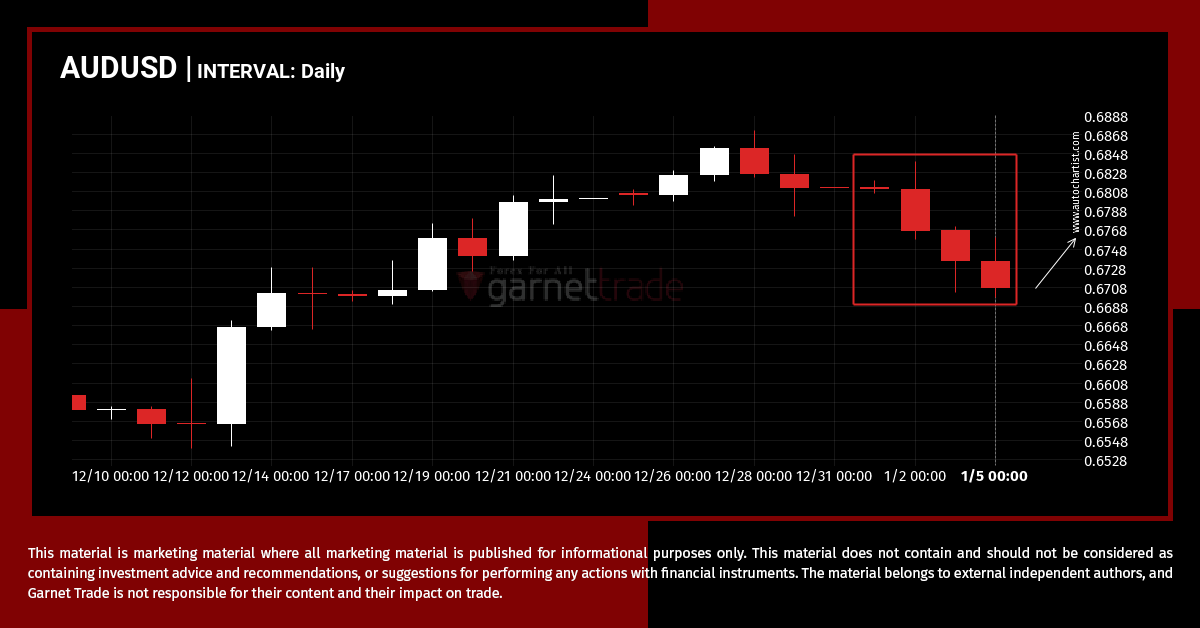
After posting 4 consecutive bearish candles in 5 days, you may start considering where AUDUSD is heading next, a continuation of the current downward trend, or a reversal in the previous direction.
Big movement possible on UKX.IND
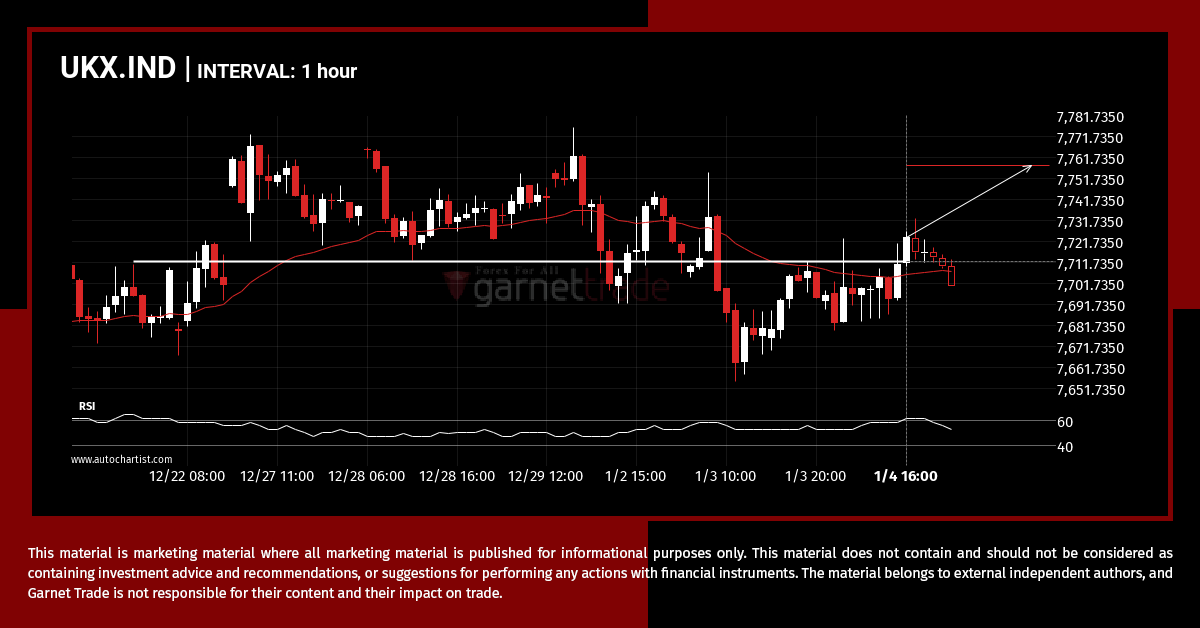
A strong resistance level has been breached at 7711.7998 on the 1 hour UKX.IND chart. Technical Analysis theory forecasts a movement to 7757.6499 in the next 16 hours.
Should we expect a breakout or a rebound on DAX.IND?
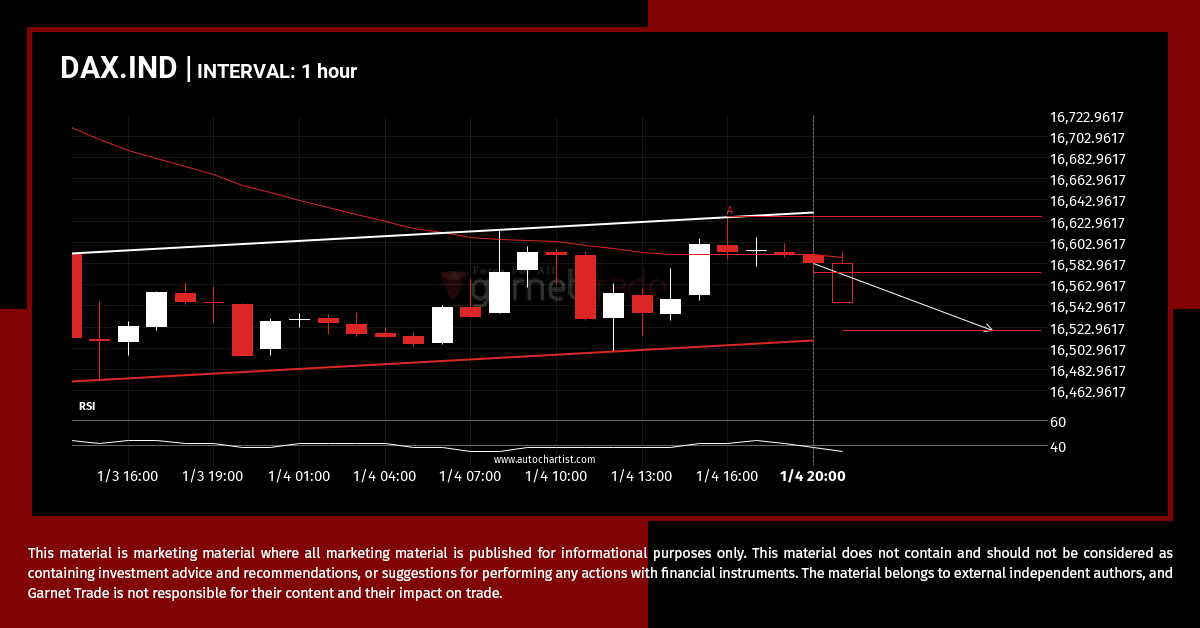
DAX.IND is approaching the support line of a Flag. It has touched this line numerous times in the last 2 days. If it tests this line again, it should do so in the next 6 hours.
Confirmed breakout on SPX.IND 1 hour chart
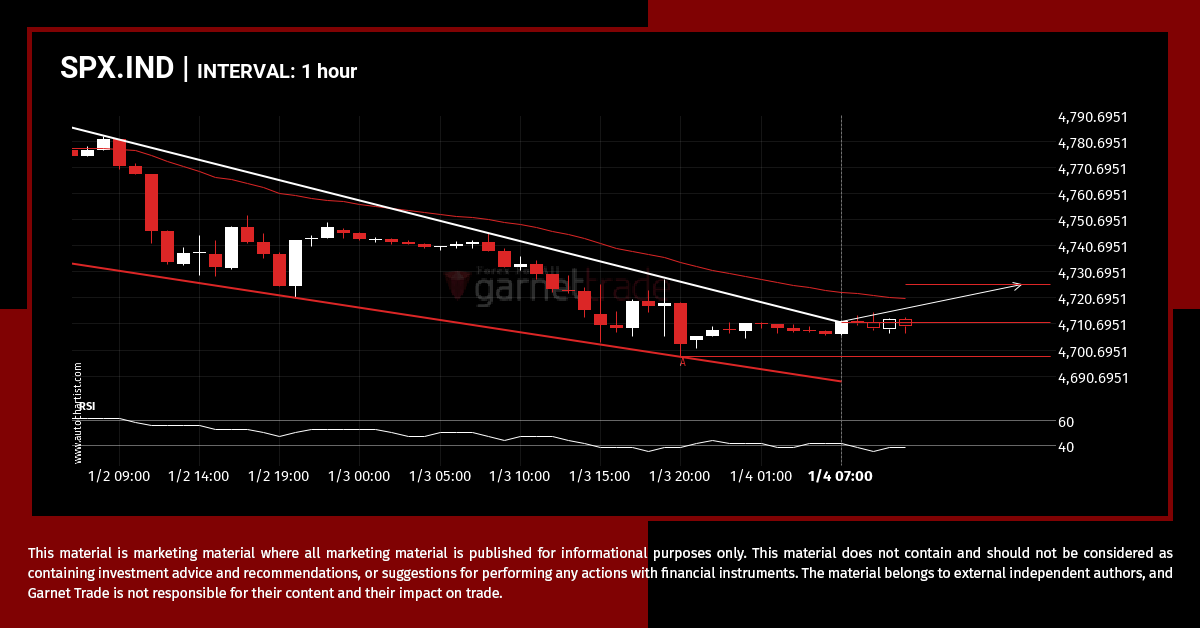
SPX.IND has broken through a resistance line. It has touched this line at least twice in the last 6 days. This breakout may indicate a potential move to 4725.7209 within the next 10 hours. Because we have seen it retrace from this position in the past, one should wait for confirmation of the breakout before […]
Should we expect a breakout or a rebound on UKX.IND?
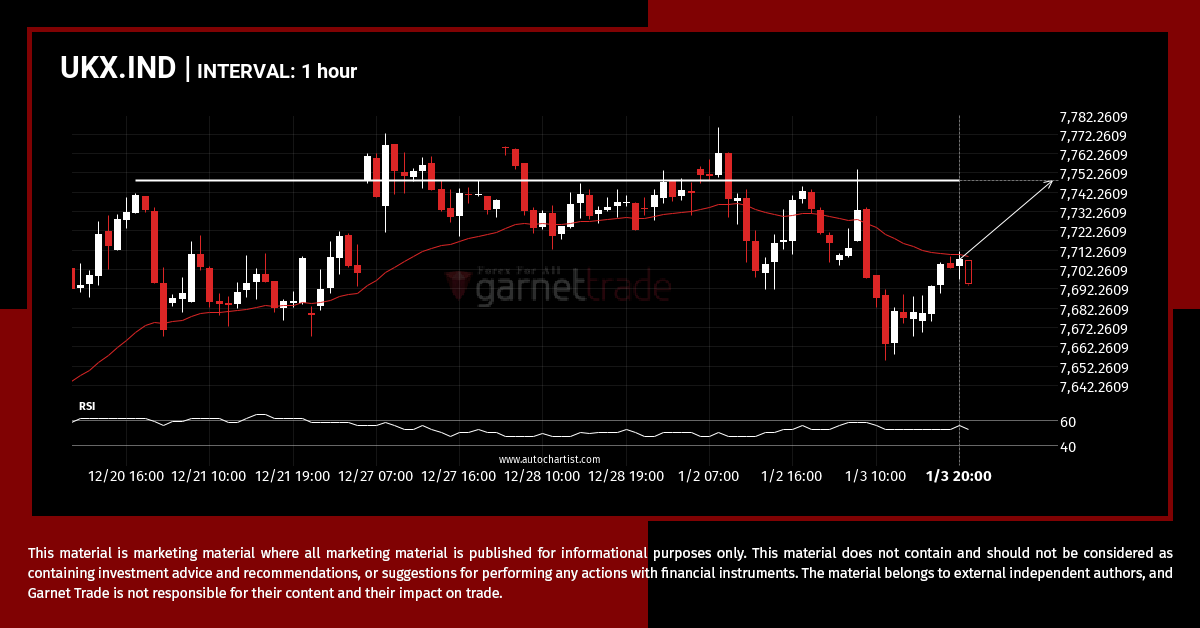
UKX.IND is about to retest a key horizontal resistance level near 7748.2002. It has tested this level 3 times in the recent past and could simply bounce off like it did last time. However, after this many tries, maybe it’s ready to start a new trend.

