USDCAD – Continuation Chart Pattern – Channel Down
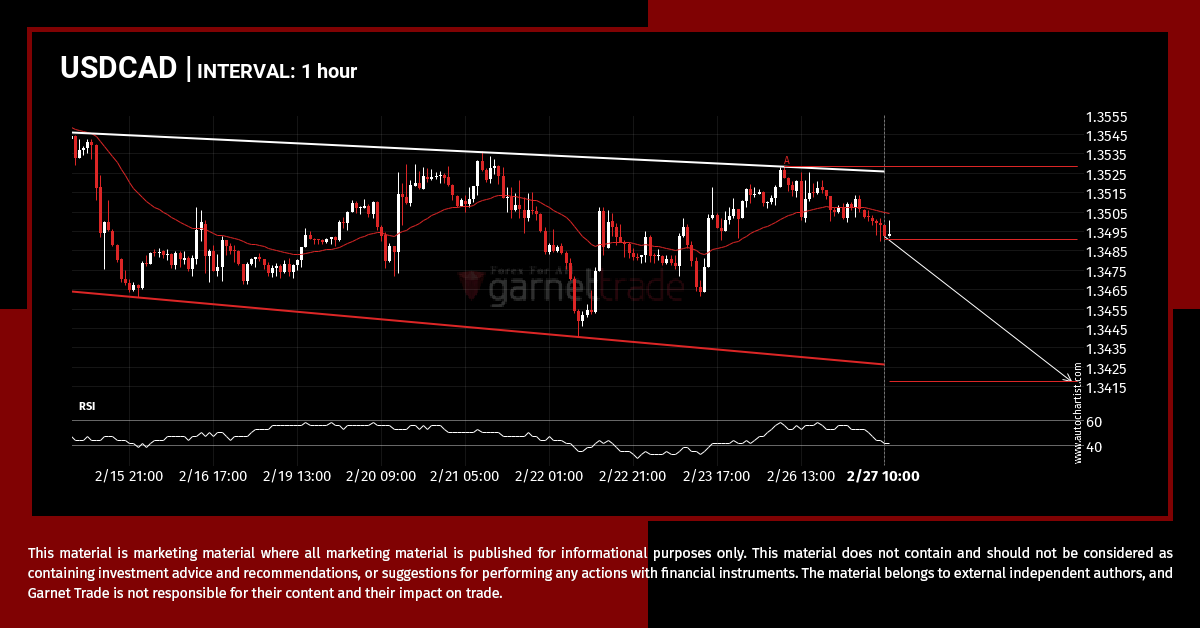
A Channel Down pattern was identified on USDCAD at 1.34911, creating an expectation that it may move to the support line at 1.3418. It may break through that line and continue the bearish trend or it may reverse from that line.
XAGUSD approaching support of a Channel Down
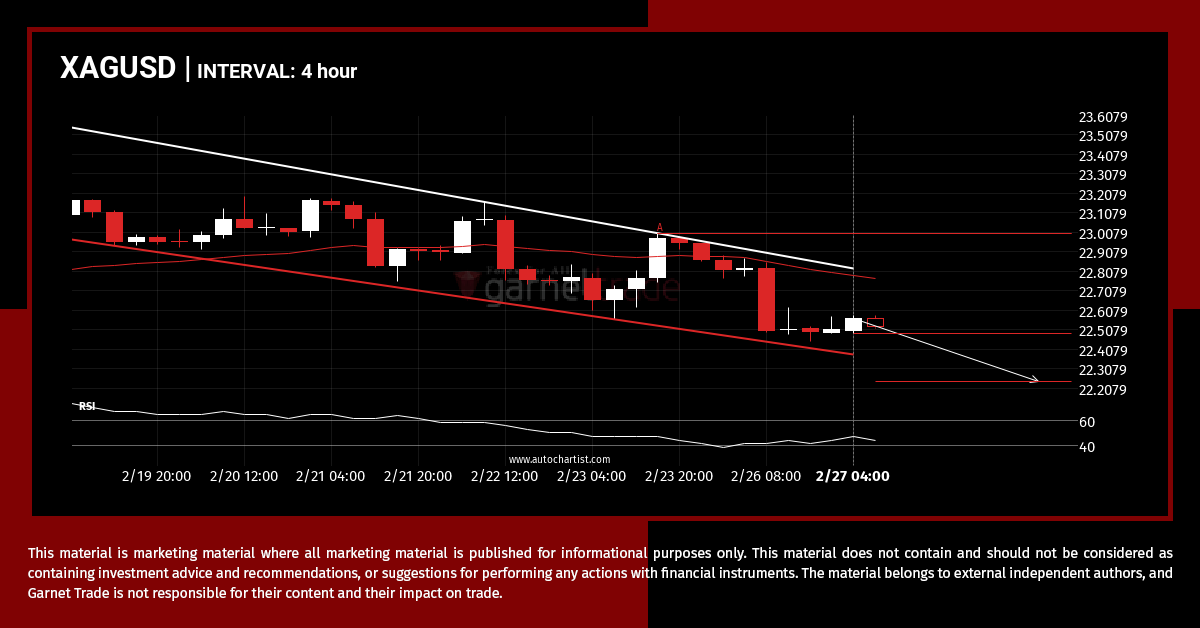
XAGUSD is trapped in a Channel Down formation, implying that a breakout is Imminent. This is a great trade-setup for both trend and swing traders. It is now approaching a resistance line that has been tested in the past. Divergence opportunists may be very optimistic about a possible breakout and this may be the start […]
AUDUSD – support line broken at 2024-02-26T19:00:00.000Z
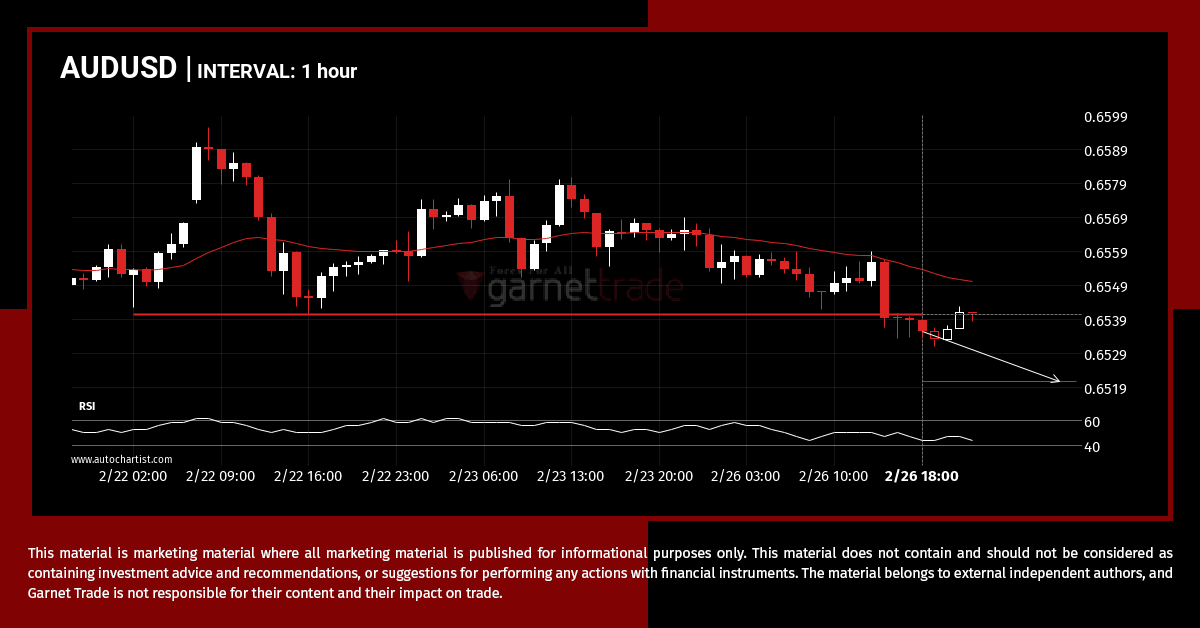
AUDUSD has breached the support line at 0.6540. It may conitnue the bearish trend towards 0.6521, or, it may prove to be yet another test of this level.
Triangle breakout on UKX.IND
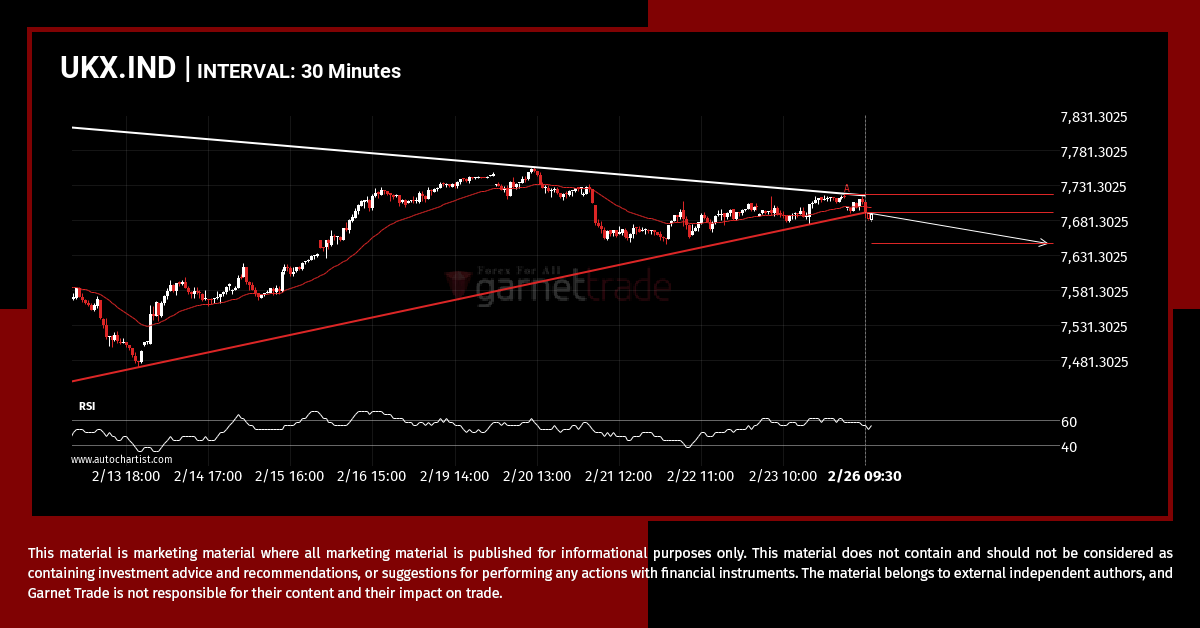
You would be well advised to confirm the breakout that has just occurred – do you believe the move through support to be significant? Do you have confirming indicators that the price momentum will continue? If so, look for a target of 7648.3796 but consider reducing the size of your position as the price gets […]
bullish technical pattern on XAUUSD 4 hour
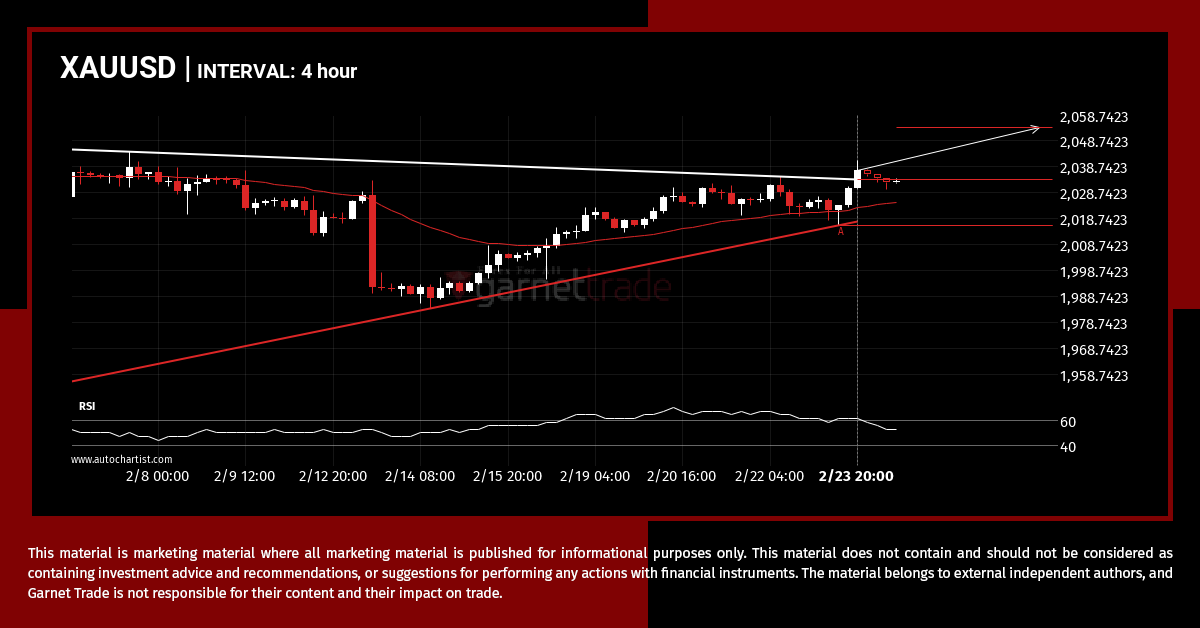
Triangle pattern identified on XAUUSD has broken through a resistance level with the price momentum continuing to move in an upward direction. A solid trading opportunity continues with the price expected to reach 2053.8558 in the next 2.
Should we expect a breakout or a rebound on AUDUSD?
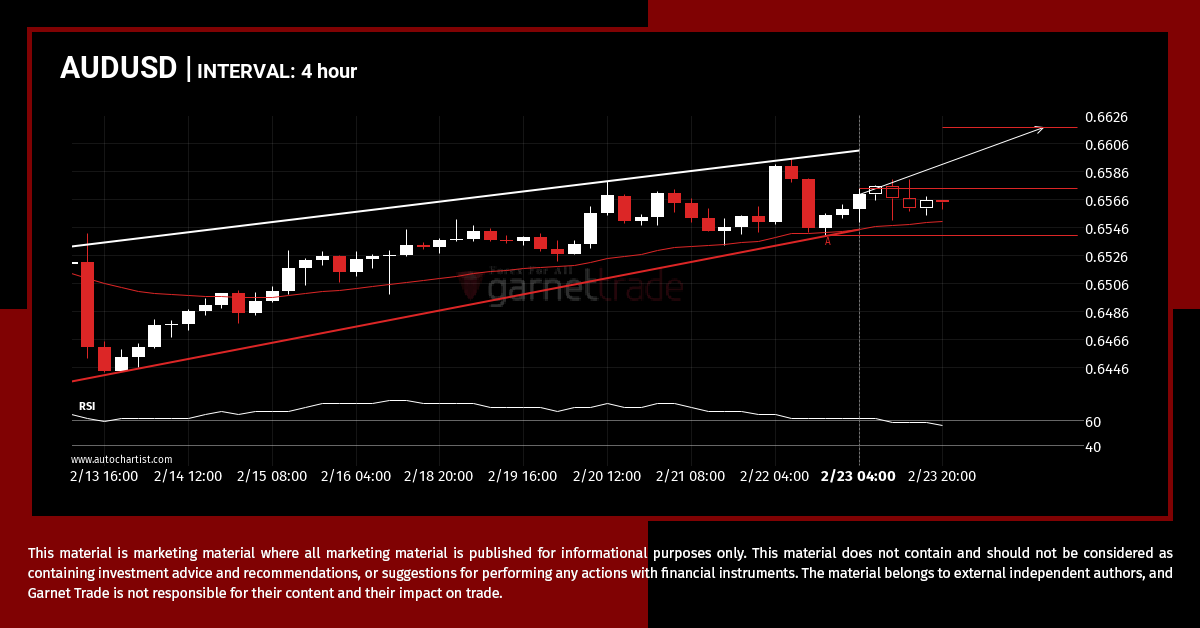
AUDUSD is approaching the resistance line of a Rising Wedge. It has touched this line numerous times in the last 11 days. If it tests this line again, it should do so in the next 2 days.
Continuation pattern on USDCHF
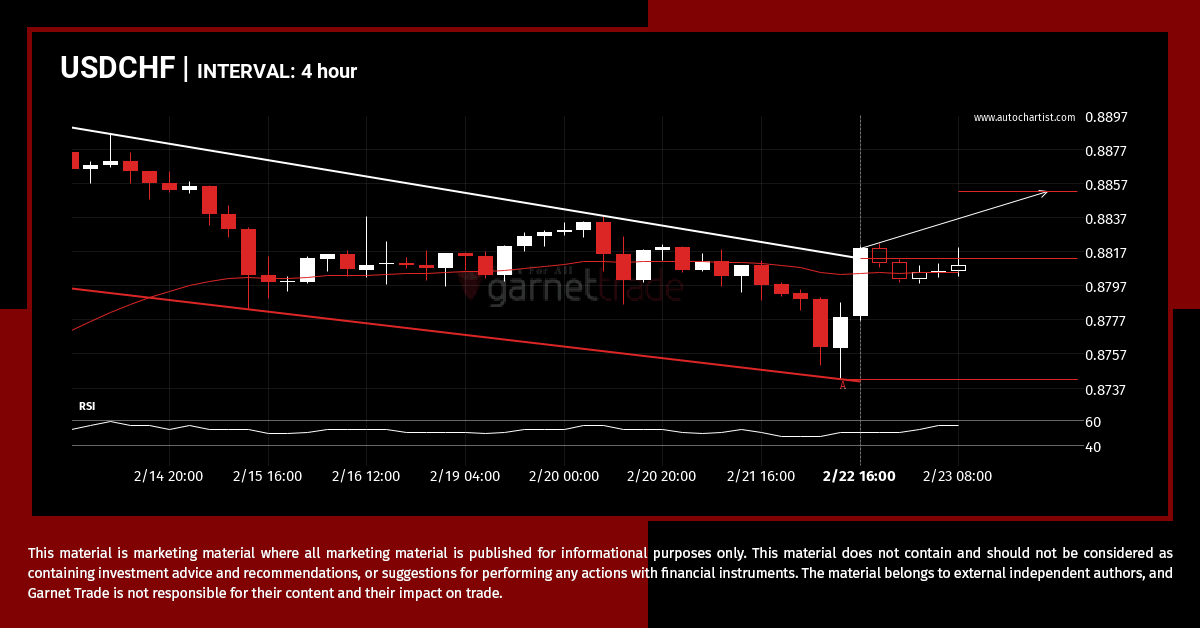
USDCHF has broken through a resistance line of a Channel Down chart pattern. If this breakout holds true, we may see the price of USDCHF testing 0.8853 within the next 2 days. But don’t be so quick to trade, it has tested this line in the past, so you should confirm the breakout before taking […]
Important price line breached by XAGUSD
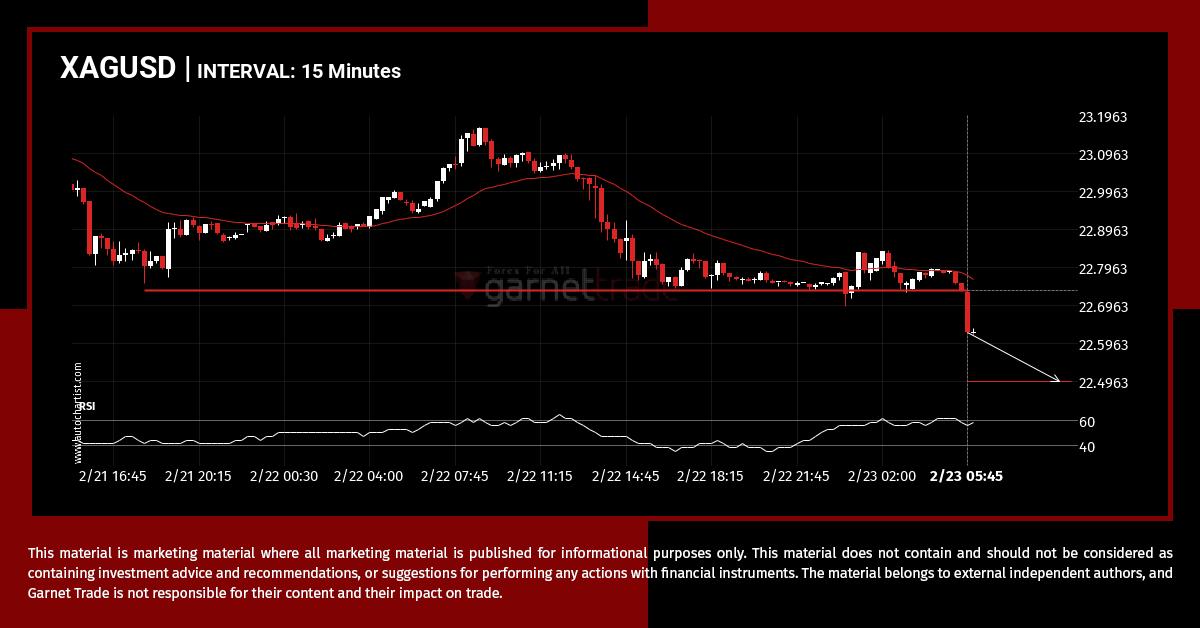
XAGUSD has broken through 22.7350 which it has tested numerous times in the past. We have seen it retrace from this price in the past. If this new trend persists, XAGUSD may be heading towards 22.4972 within the next 8 hours.
A potential bullish movement on GBPUSD
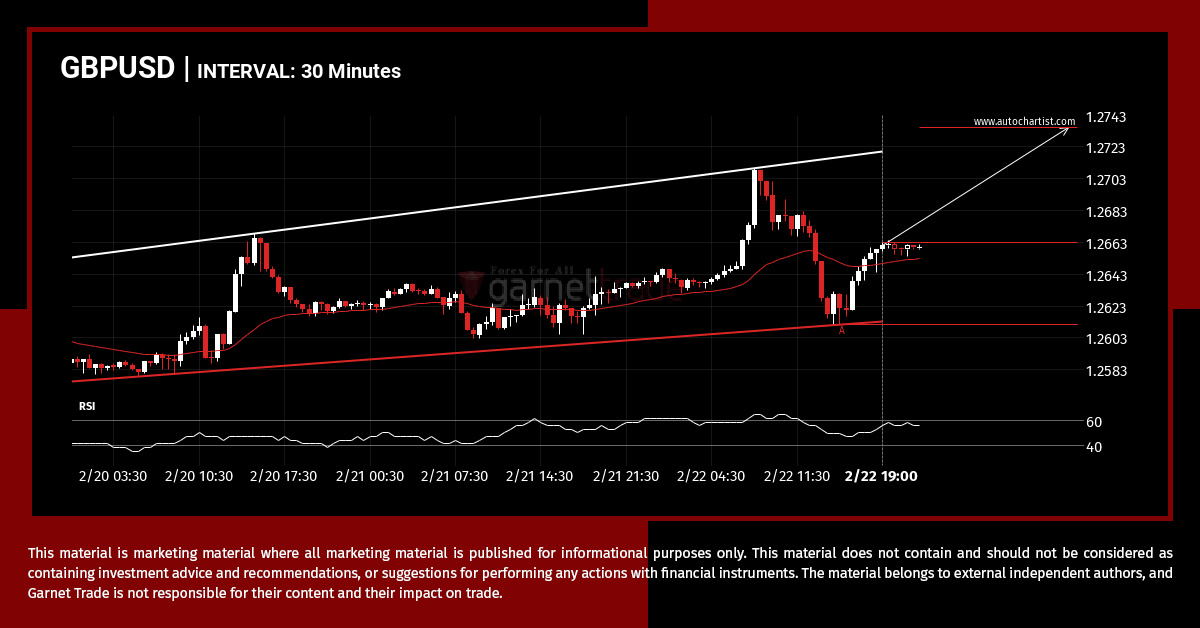
An emerging Channel Up has been detected on GBPUSD on the 30 Minutes chart. There is a possible move towards 1.2735 next few candles. Once reaching support it may continue its bullish run or reverse back to current price levels.
EURUSD was on its way up
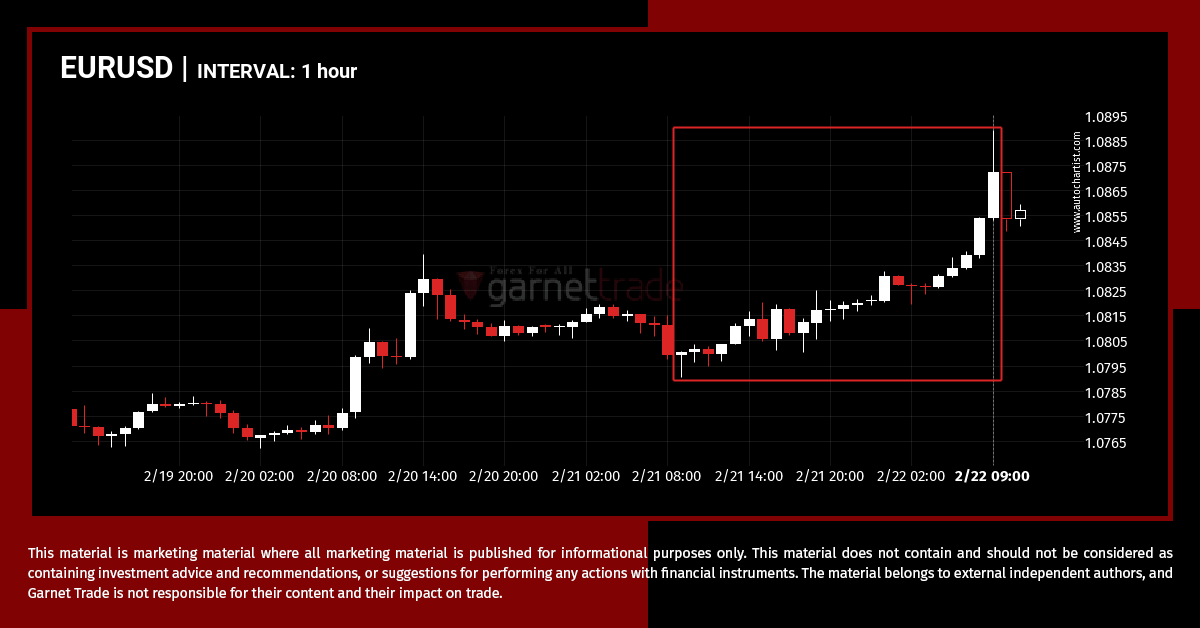
EURUSD rose sharply for day – which is an excessively big movement for this instrument; exceeding the 98% of past price moves. Even if this move is a sign of a new trend in EURUSD there is a chance that we will witness a correction, no matter how brief.

