There was a bullish move on UKX.IND
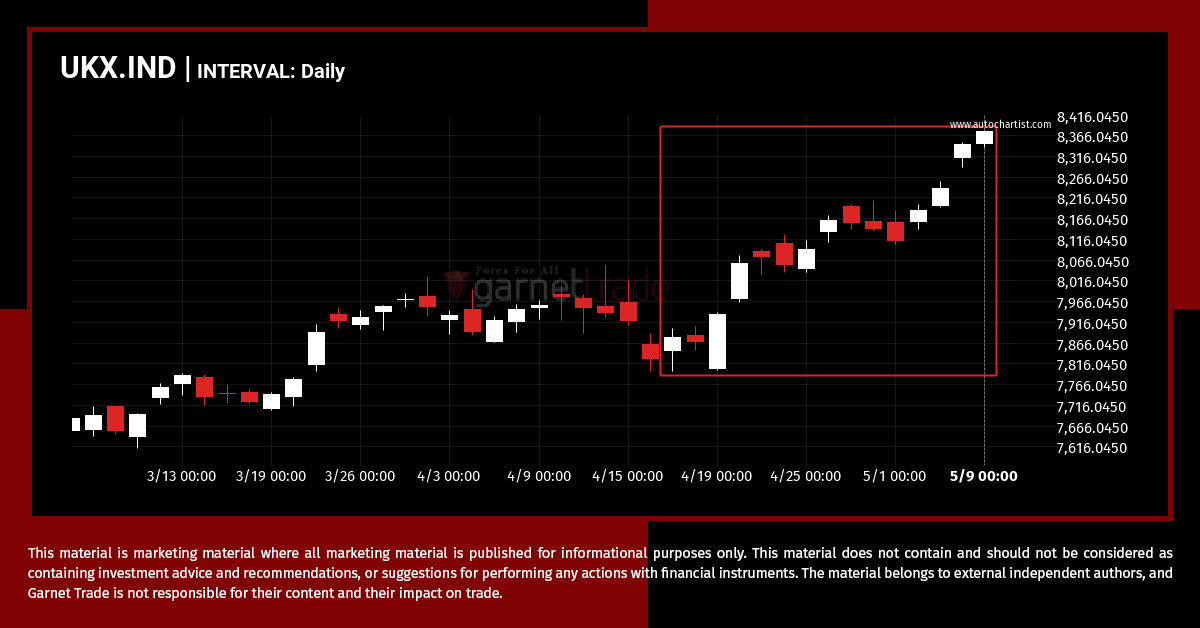
UKX.IND has experienced an extremely big movement in last 22 days. It may continue the trend, but this would make the move unprecedented in the recent past.
SPX.IND trade outlook at 2024-05-09T06:00:00.000Z until 2024-05-09T06:00:00.000Z
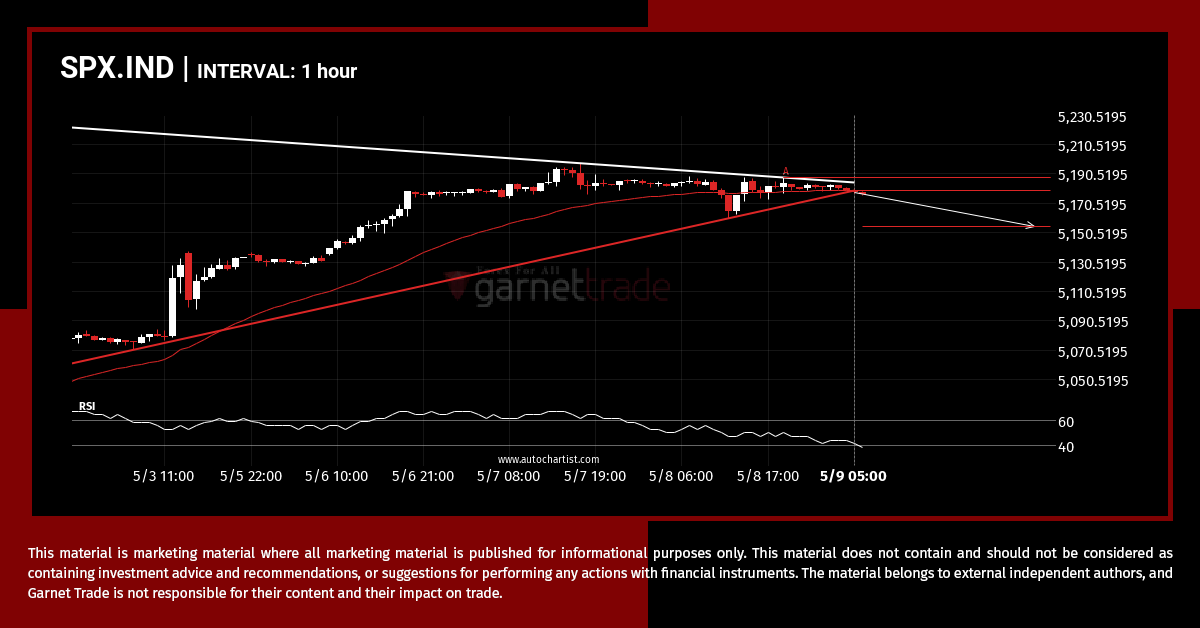
The last 7 1 hour candles on SPX.IND formed a Triangle pattern and broken out through the pattern lines, indicating a possible bearish movement towards the price level of 5154.5556.
XAUUSD approaches important level of 2305.0801
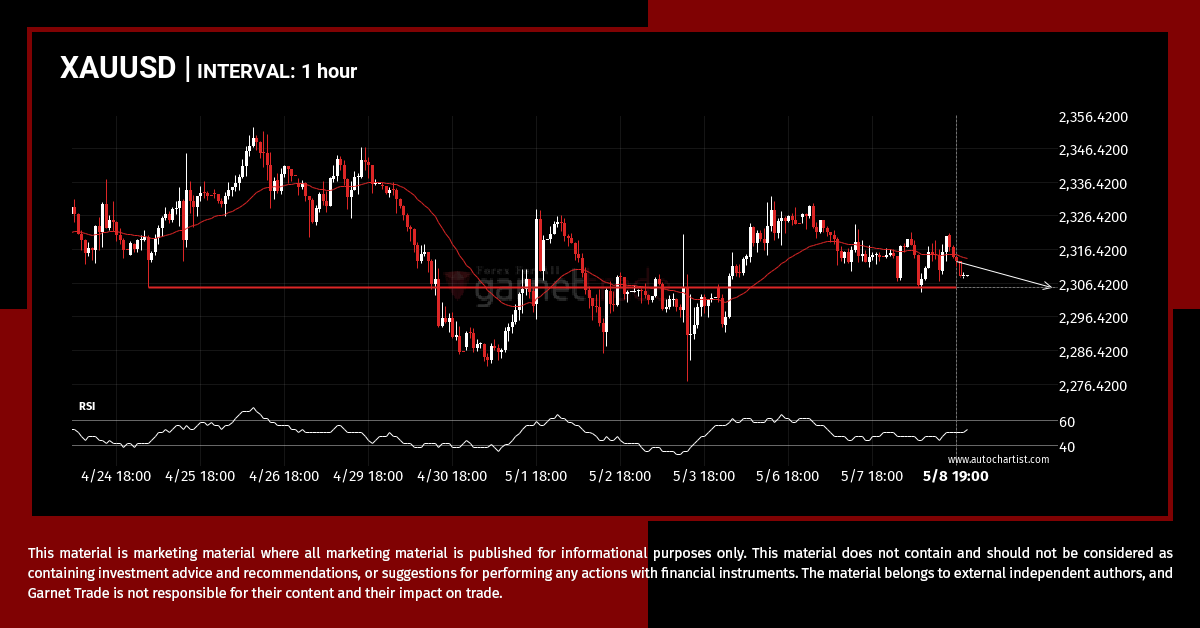
The price of XAUUSD in heading back to the support area. It is possible that it will struggle to break through it and move back in the other direction. The price may eventually break through, but typically the price retreats from the level a number of times before doing so.
XAGUSD breakout through support
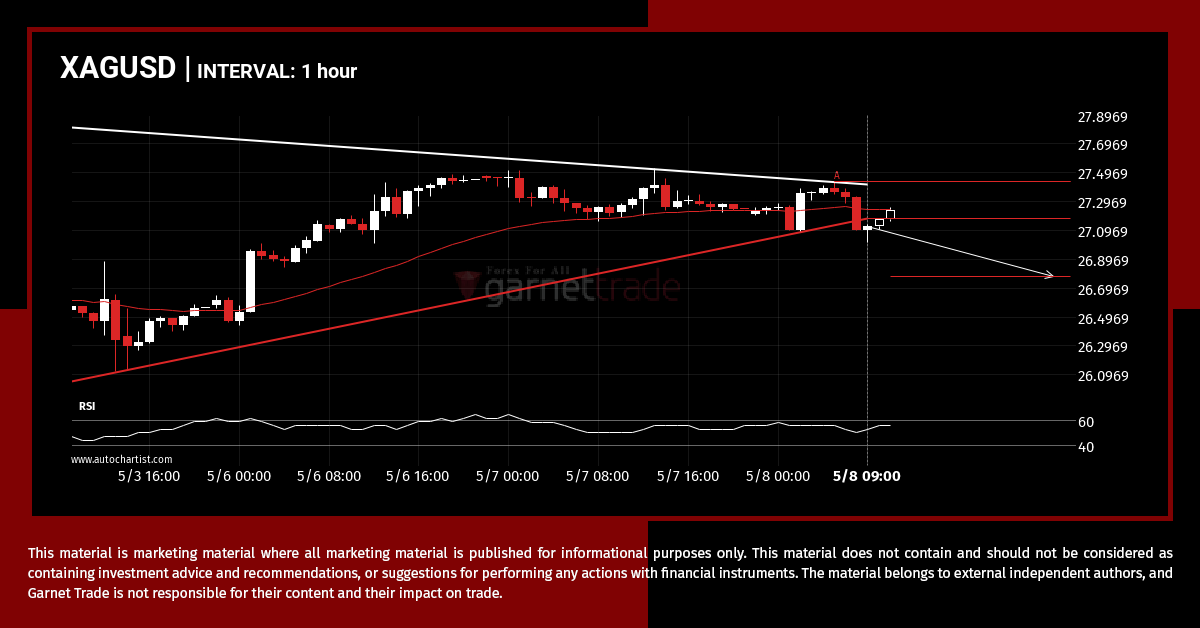
XAGUSD moved through the support line of a Triangle at 27.180400000000002 on the 1 hour chart. This line has been tested a number of times in the past and this breakout could mean an upcoming change from the current trend. It may continue in its current direction toward 26.7781.
UKX.IND running upward, don’t miss out.
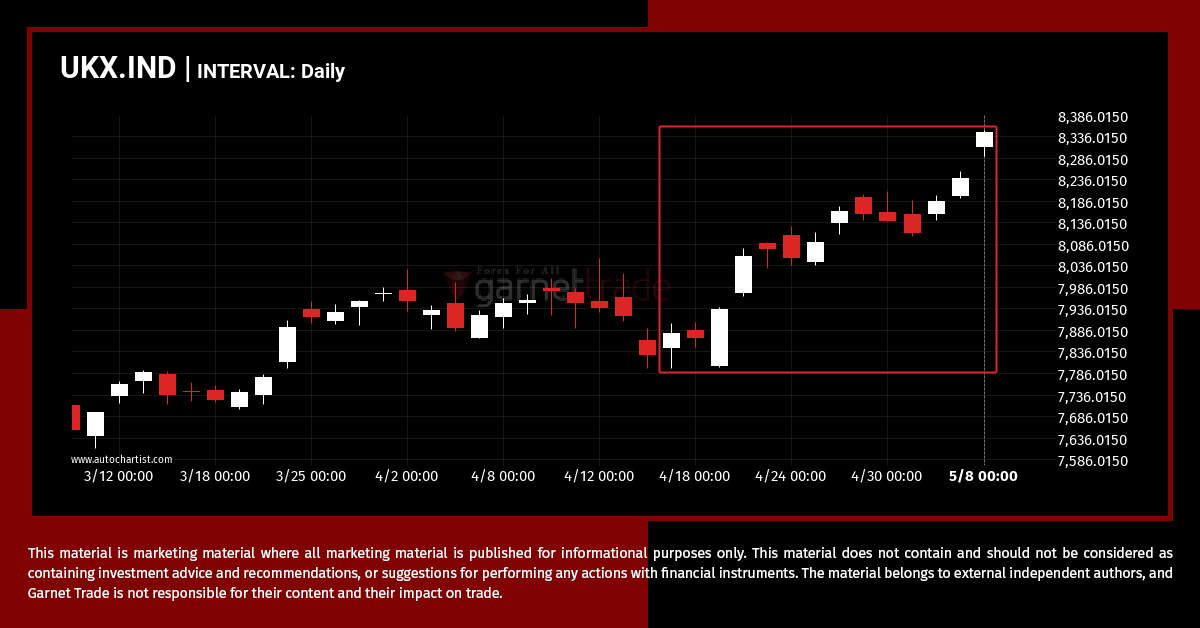
UKX.IND hits 8345.2 after a 5.92% move spanning 22 days.
Should we expect a bearish trend on GBPUSD?
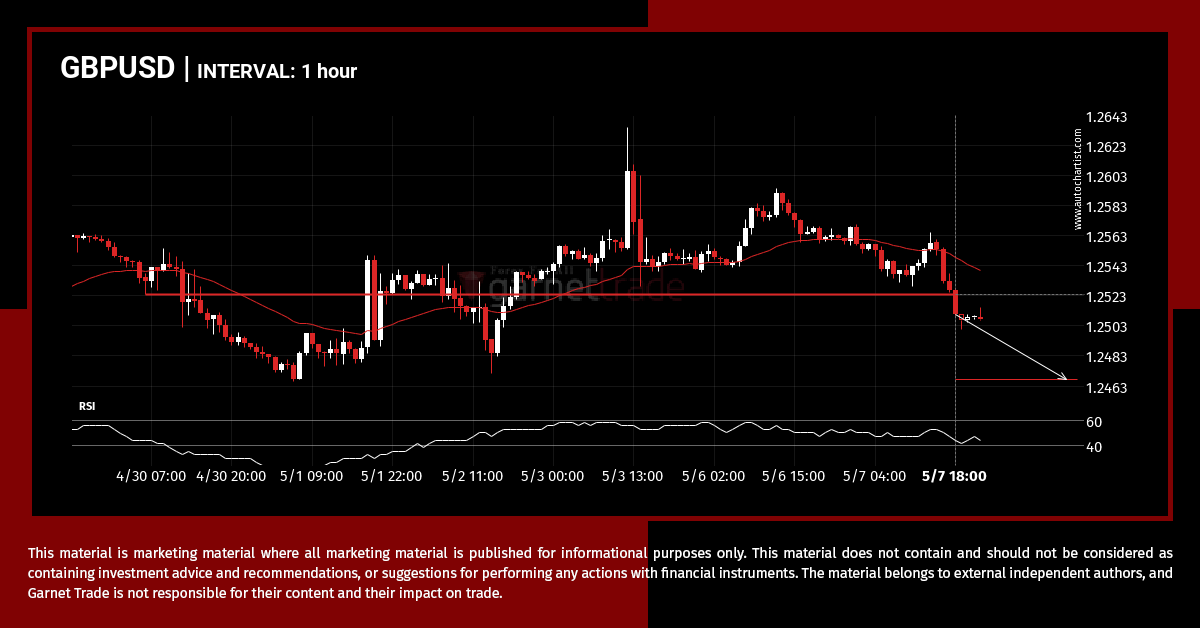
The price of GBPUSD in heading in the direction of 1.2468. Despite the recent breakout through 1.2524 it is possible that it will struggle to gain momentum to the forecast price and move back in the other direction. This has happened many times in the past so watch for a possible bounce back.
Possible breach of resistance level by SPX.IND
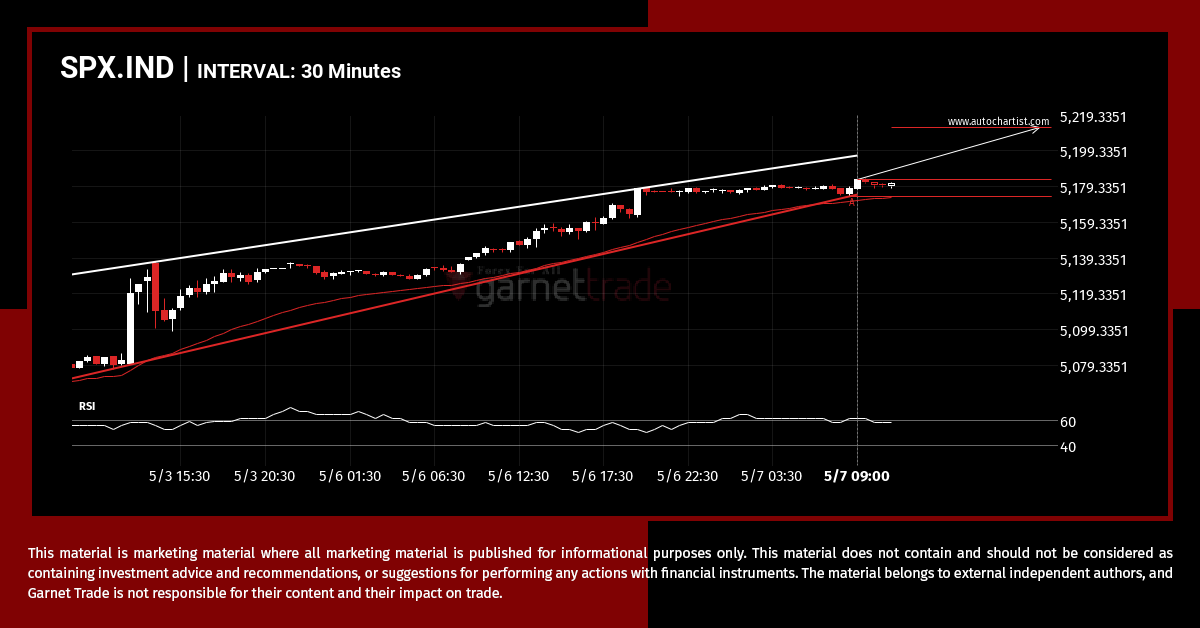
Emerging Rising Wedge detected on SPX.IND – the pattern is an emerging one and has not yet broken through support, but the price is expected to move up over the next few hours. The price at the time the pattern was found was 5183.23 and it is expected to move to 5212.2433.
Recent bullish run on UKX.IND. Continuation or reversal to follow?
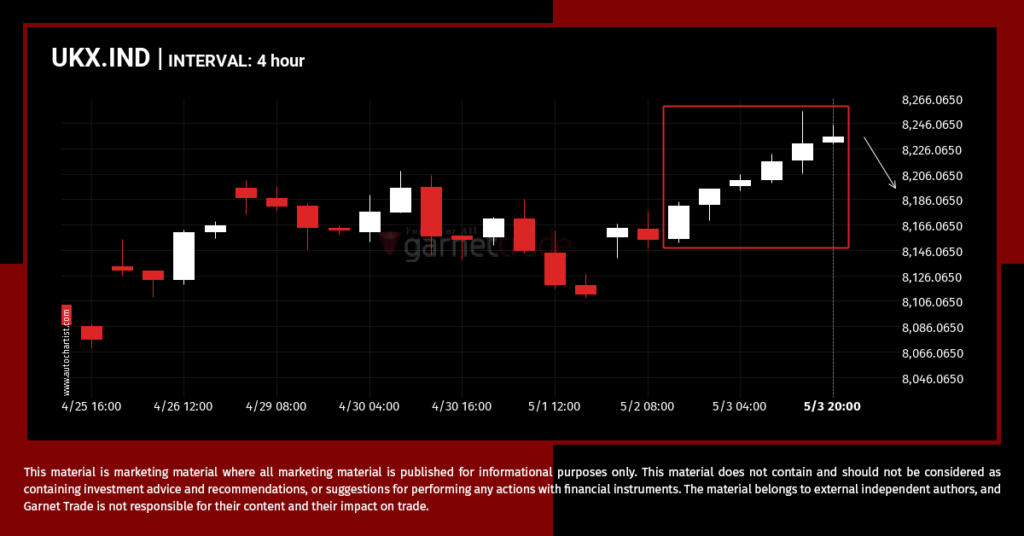
After posting 6 consecutive bullish candles in 2 days, you may start considering where UKX.IND is heading next, a continuation of the current upward trend, or a reversal in the previous direction.
NDX.IND running upward, don’t miss out.
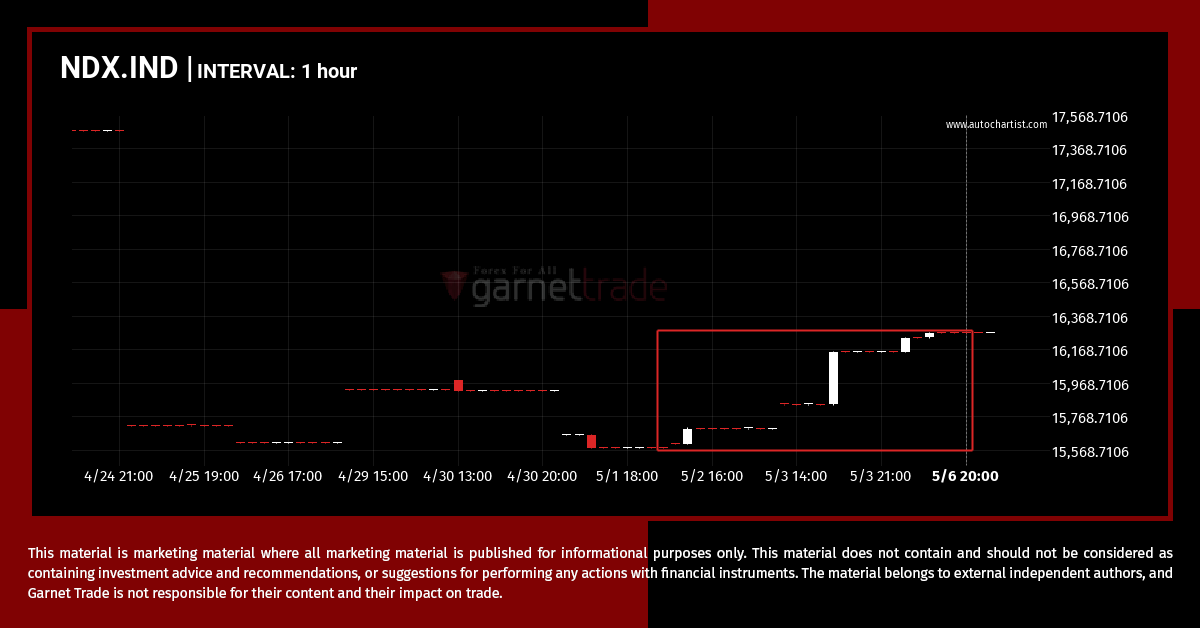
For those of you that don’t believe in trends, this may be an opportunity to take advantage of an exceptional 4.38% move on NDX.IND. The movement has happened over the last 5 days. For those trend followers among you, you may think about riding this possible trend.
Resistance breakout on DAX.IND
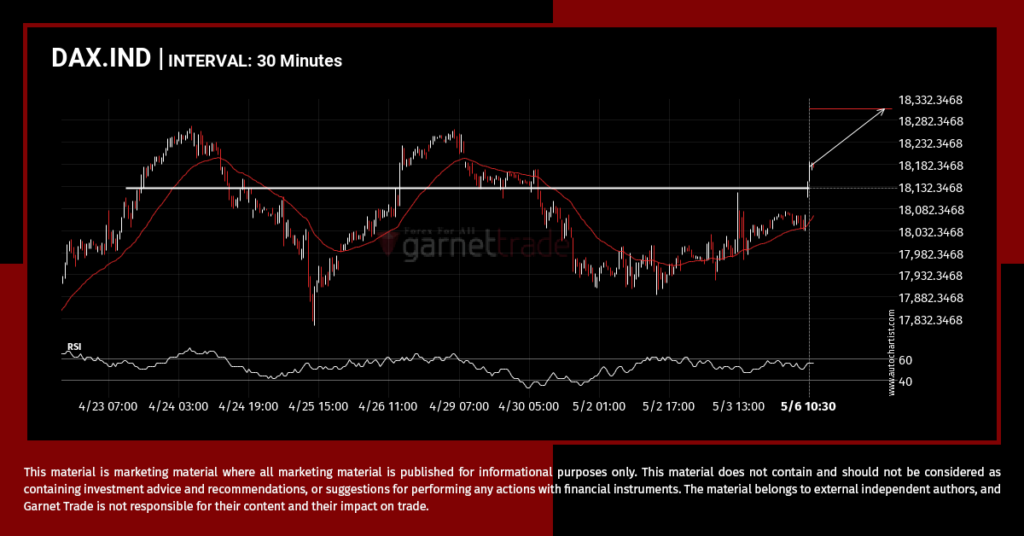
DAX.IND has broken through a resistance line. Because we have seen it retrace from this price in the past, one should wait for confirmation of the breakout before trading. It has touched this line numerous times in the last 13 days and suggests a possible target level to be around 18307.8398 within the next 2 […]

