Possible breach of support level by USDCAD
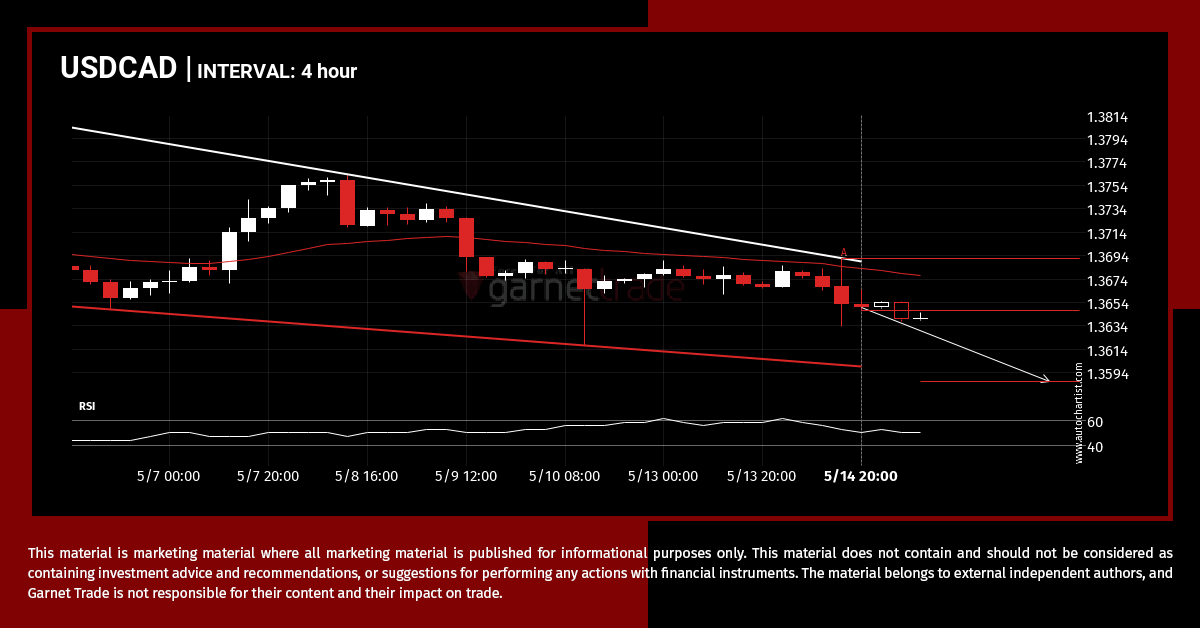
A Falling Wedge pattern was identified on USDCAD at 1.36467, creating an expectation that it may move to the support line at 1.3586. It may break through that line and continue the bearish trend or it may reverse from that line.
XAGUSD approaching important bullish key level
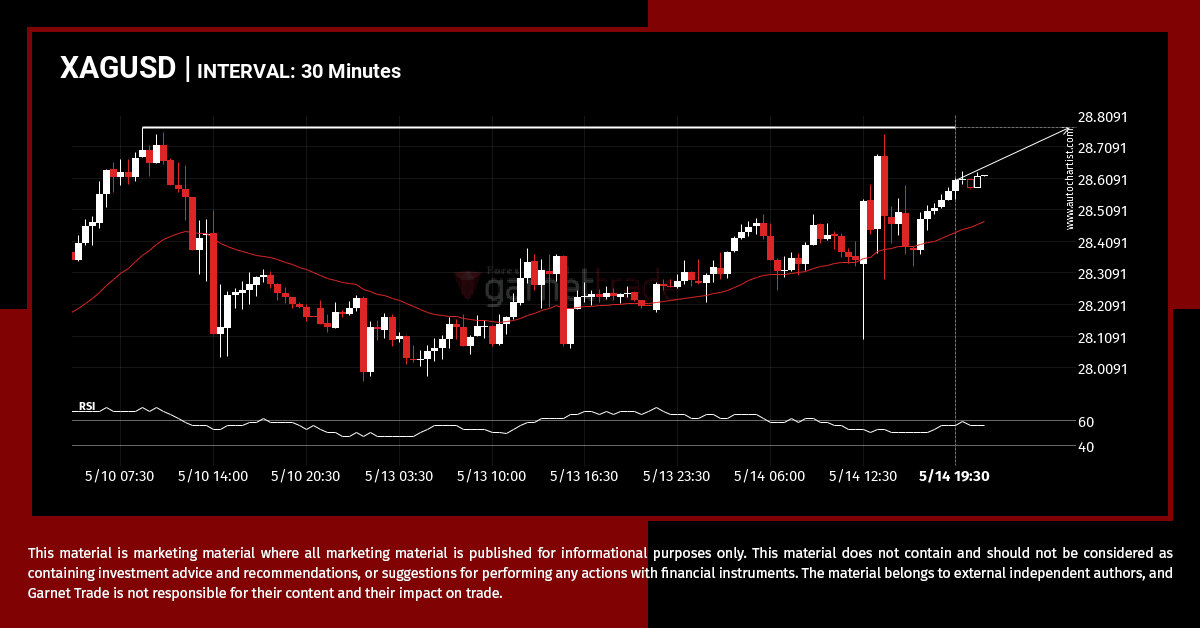
XAGUSD is moving towards a key resistance level at 28.7690. XAGUSD has previously tested this level 3 times and on each occasion it has bounced back off this level. Is this finally the time it will break through?
XAUUSD has broken through resistance
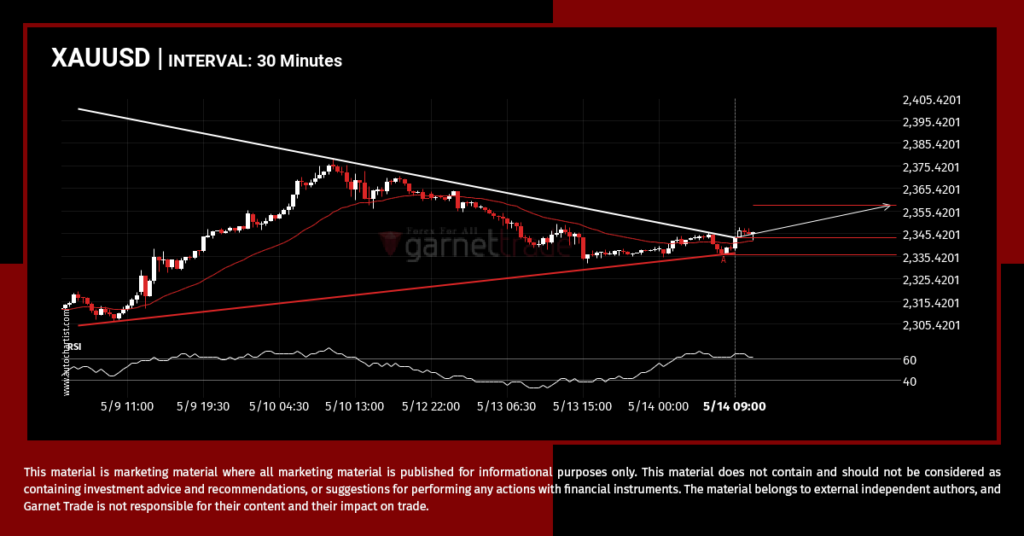
This trade setup on XAUUSD is formed by a period of consolidation; a period in which the price primarily moves sideways before choosing a new direction for the longer term. Because of the bullish breakout through resistance, it seems to suggest that we could see the next price move to 2357.8502.
GBPUSD – resistance line broken at 2024-05-13T14:00:00.000Z
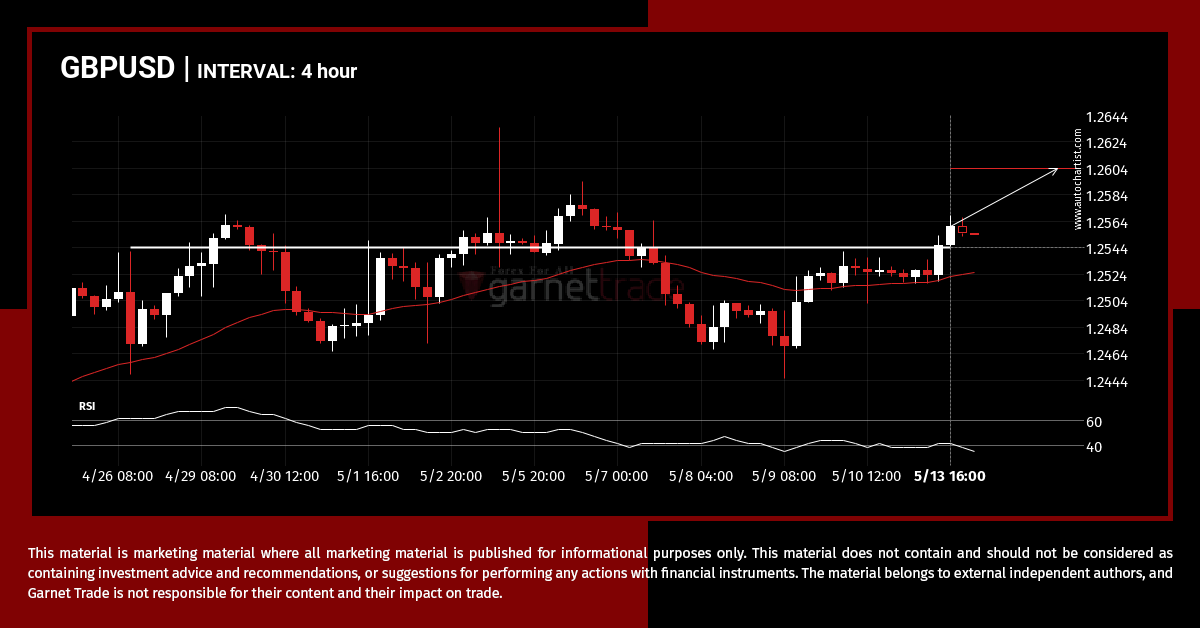
GBPUSD has broken through 1.2545 which it has tested numerous times in the past. We have seen it retrace from this price in the past. If this new trend persists, GBPUSD may be heading towards 1.2604 within the next 3 days.
USDCHF – resistance line broken at 2024-05-13T11:00:00.000Z
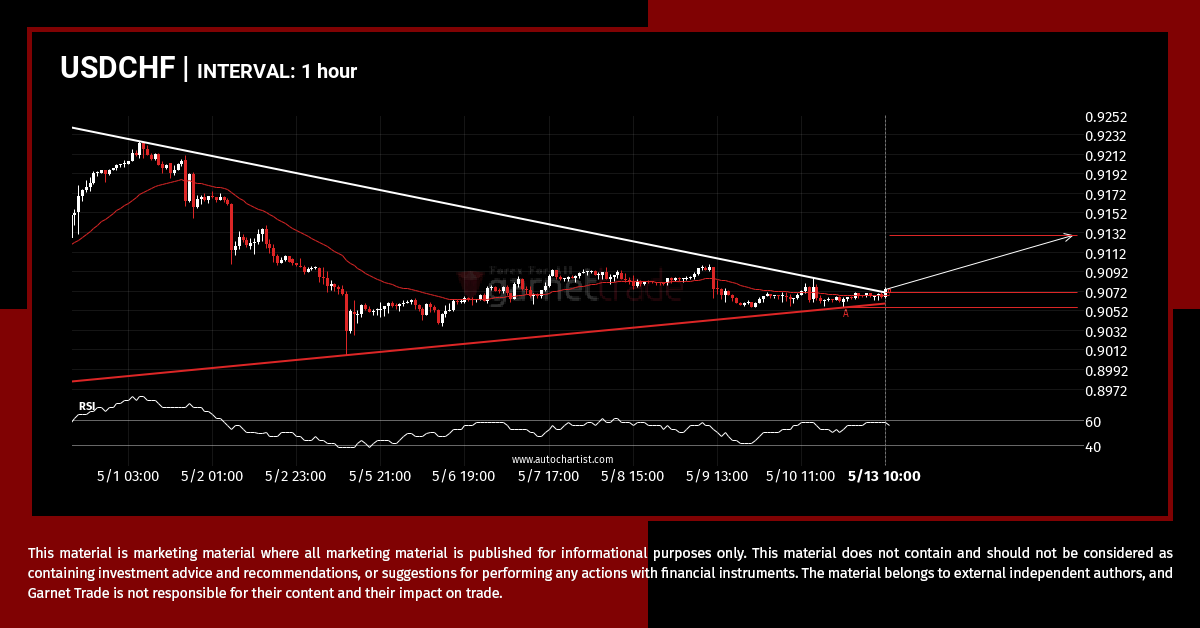
Triangle pattern identified on USDCHF has broken through a resistance level with the price momentum continuing to move in an upward direction. A solid trading opportunity continues with the price expected to reach 0.9129 in the next 3.
Is UKX.IND likely to correct after this massive movement?
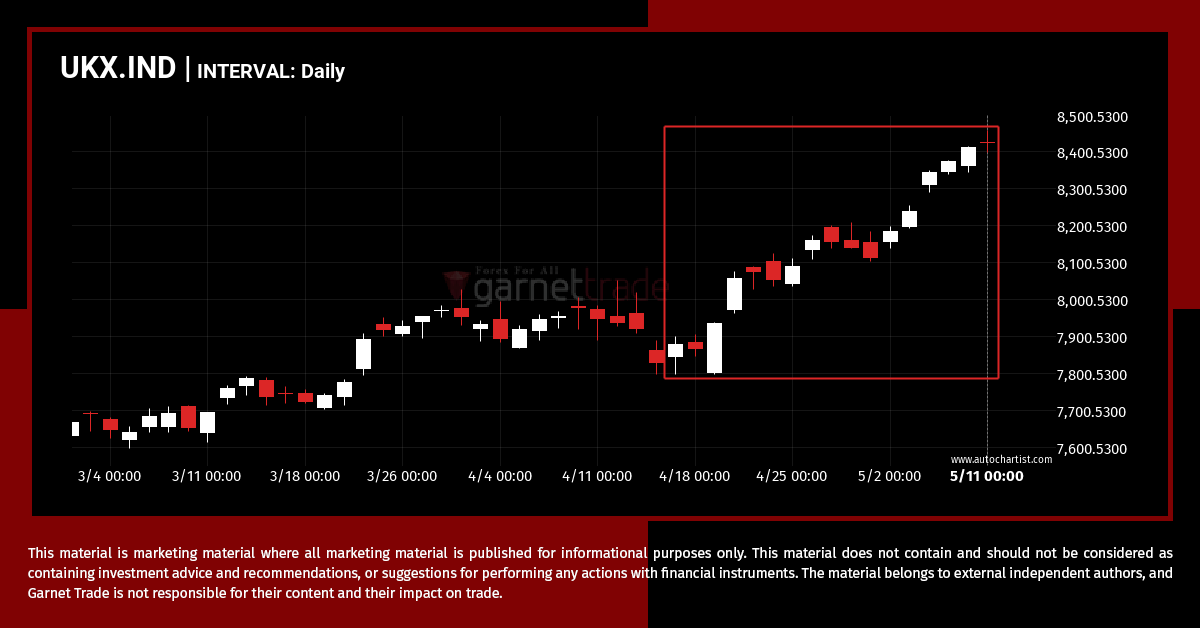
UKX.IND hits 8423.8 after a 6.92% move spanning 25 days.
USDCAD is on the approach
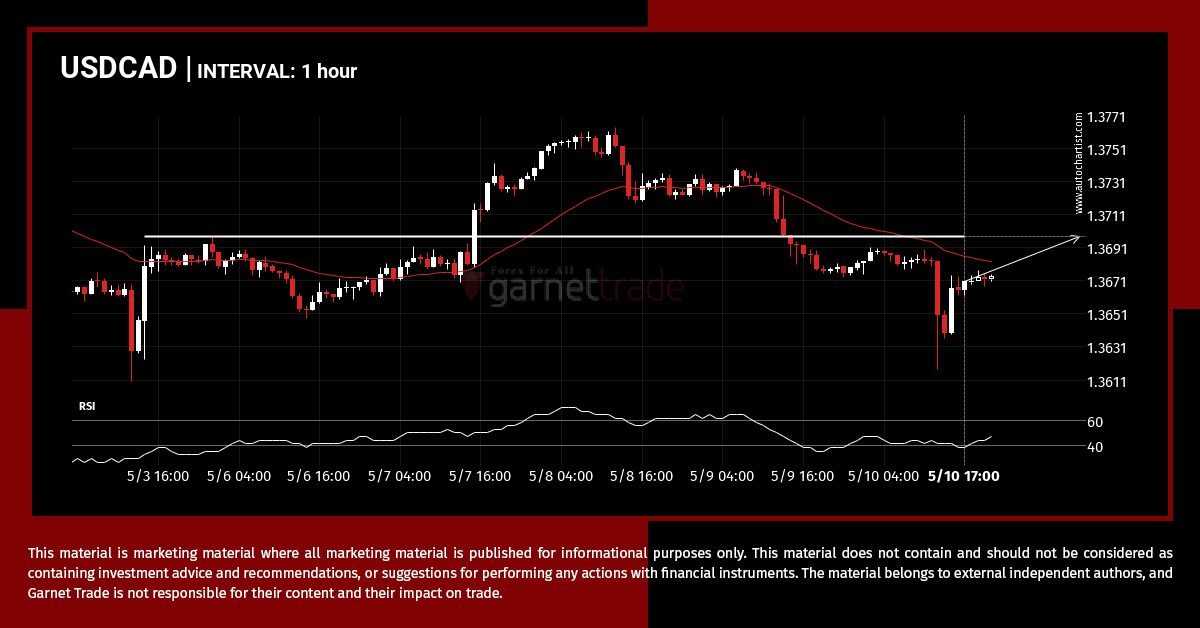
USDCAD is moving towards a key resistance level at 1.3697. USDCAD has previously tested this level 5 times and on each occasion it has bounced back off this level. Is this finally the time it will break through?
Did you miss this move on XAUUSD?
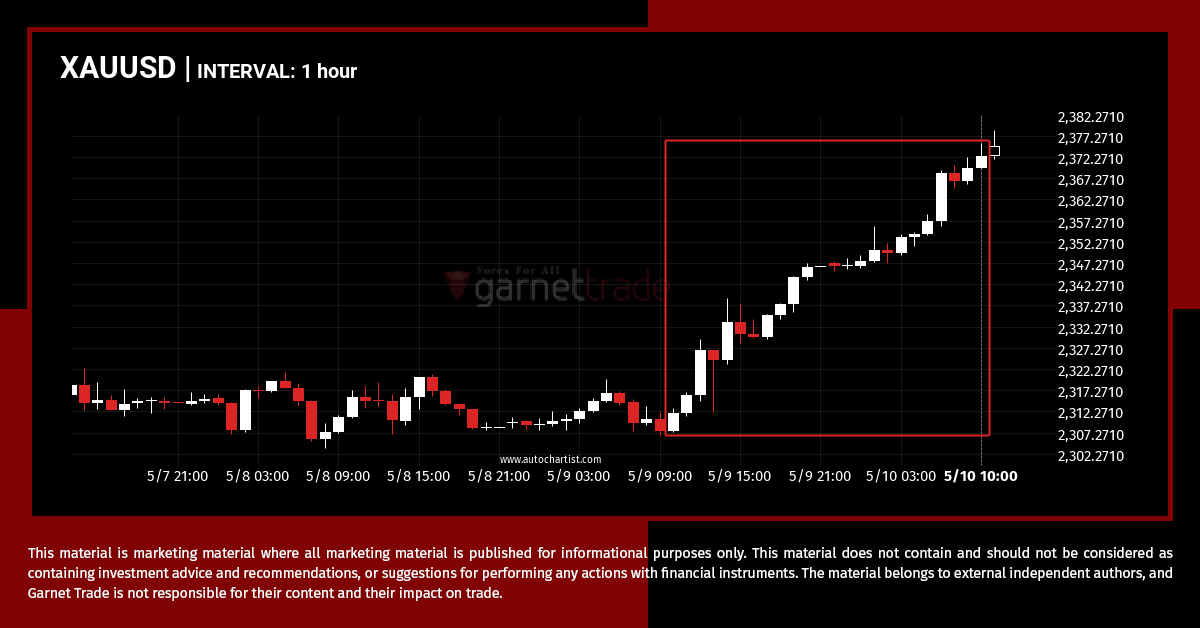
XAUUSD rose sharply for day – which is an excessively big movement for this instrument; exceeding the 98% of past price moves. Even if this move is a sign of a new trend in XAUUSD there is a chance that we will witness a correction, no matter how brief.
EURUSD – Continuation Chart Pattern – Channel Up
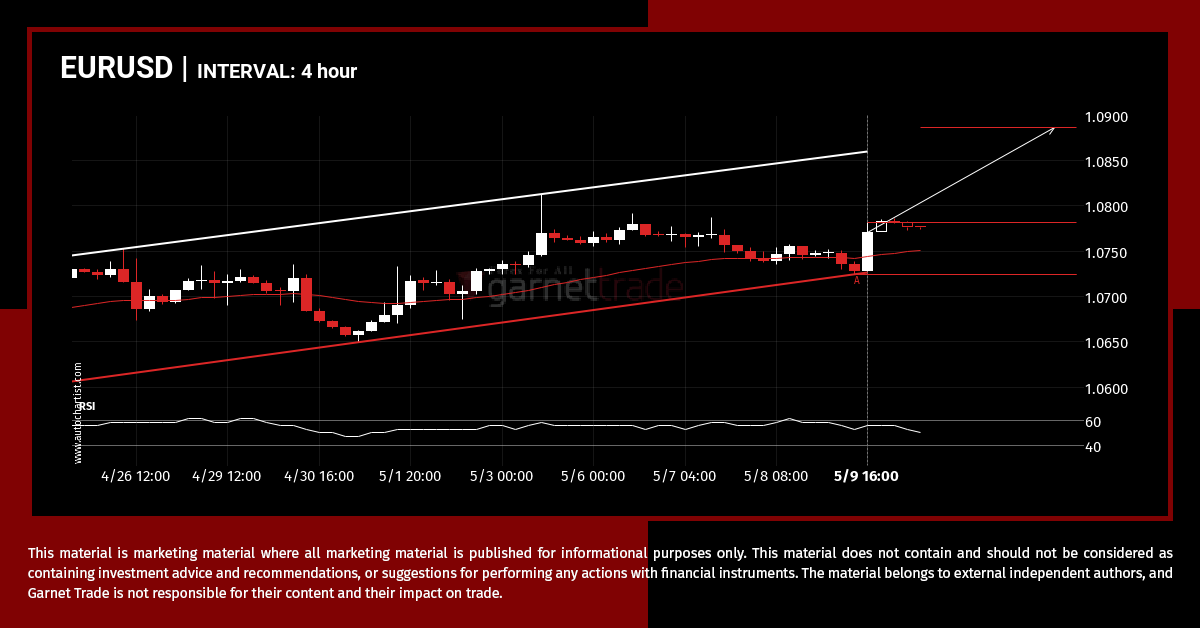
Emerging Channel Up pattern in its final wave was identified on the EURUSD 4 hour chart. After a strong bullish run, we find EURUSD heading towards the upper triangle line with a possible resistance at 1.0886. If the resistance shows to hold, the Channel Up pattern suggests a rebound back towards current levels.
Possible start of a bullish trend as GBPUSD breaks resistance
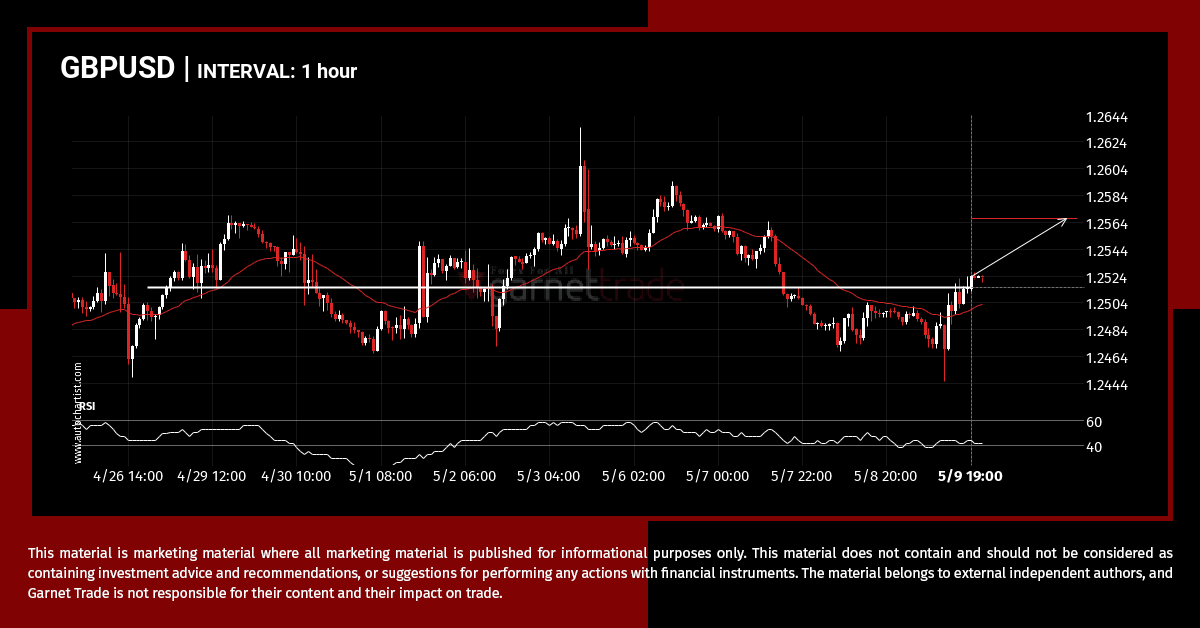
GBPUSD has broken through a resistance line. It has touched this line numerous times in the last 14 days. This breakout shows a potential move to 1.2567 within the next 3 days. Because we have seen it retrace from this level in the past, one should wait for confirmation of the breakout.

