bullish technical pattern on AUDUSD 4 hour
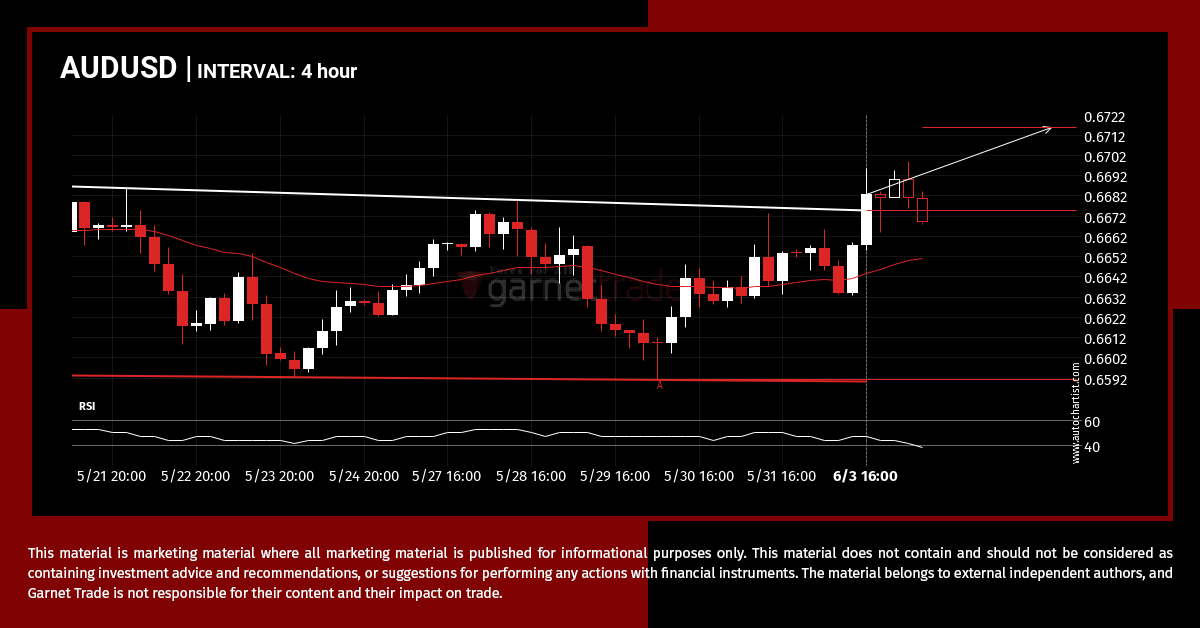
AUDUSD has broken through the resistance line which it has tested twice in the past. We have seen it retrace from this line before, so one should wait for confirmation of the breakout before trading. If this new trend persists, a target level of around 0.6715 may materialize within the next 3 days.
Rare set of consecutive bearish candles on USDCHF
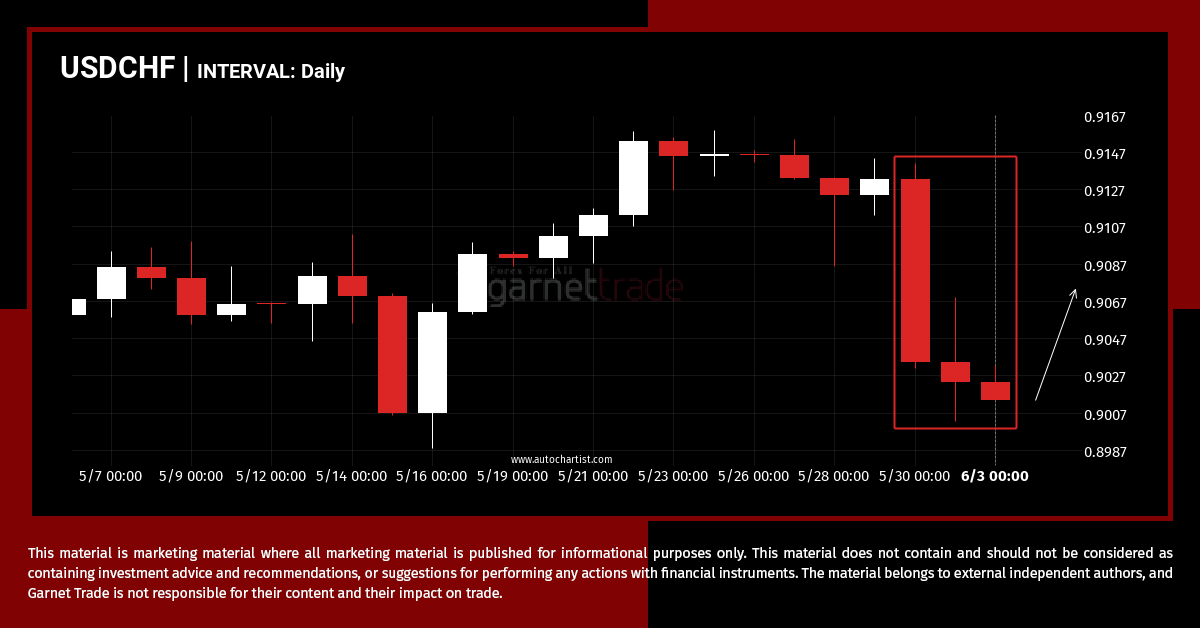
USDCHF has moved lower after 4 consecutive daily candles from 0.9133 to 0.9014 in the last 5 days.
Either a rebound or a breakout imminent on XAGUSD
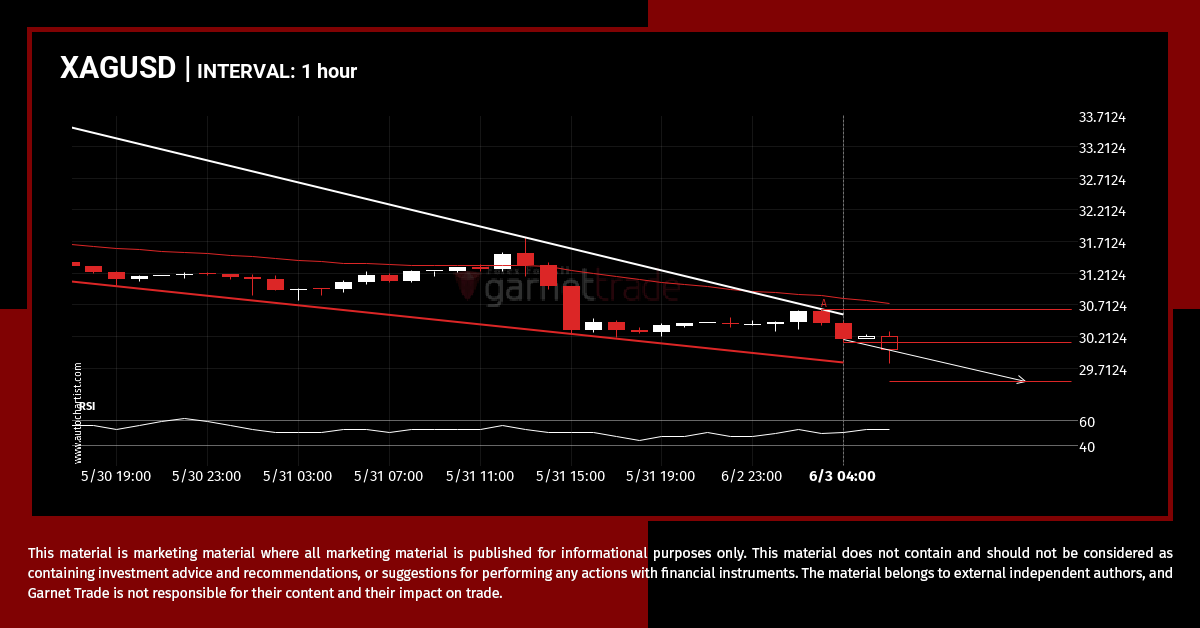
A Falling Wedge pattern was identified on XAGUSD at 30.116, creating an expectation that it may move to the support line at 29.5030. It may break through that line and continue the bearish trend or it may reverse from that line.
SPX.IND approaching important level of 5321.0801
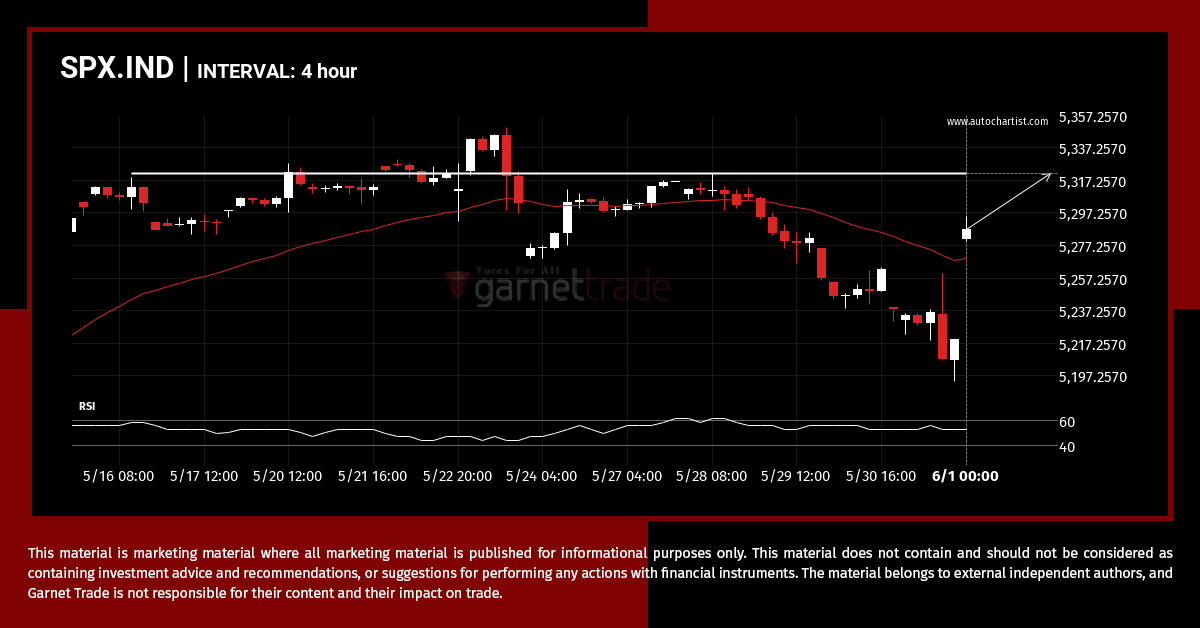
The price of SPX.IND in heading back to the resistance area. It is possible that it will struggle to break through it and move back in the other direction. The price may eventually break through, but typically the price retreats from the level a number of times before doing so.
USDTRY – getting close to psychological price line
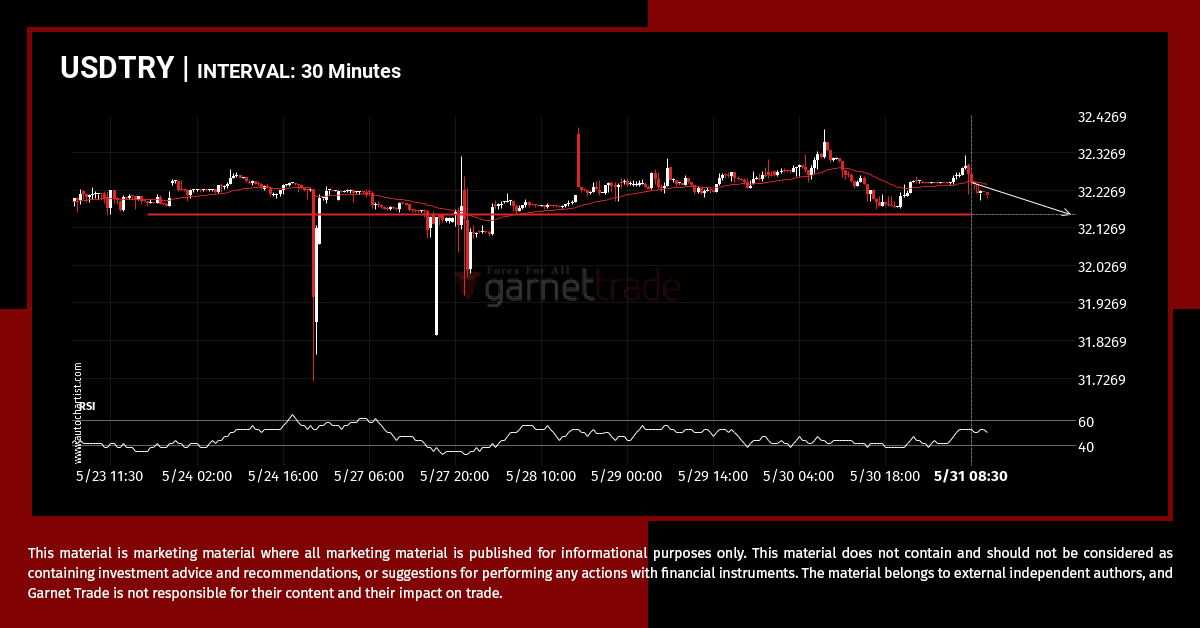
USDTRY is about to retest a key horizontal support level near 32.1613. It has tested this level 8 times in the recent past and could simply bounce off like it did last time. However, after this many tries, maybe it’s ready to start a new trend.
NDX.IND is moving, act now
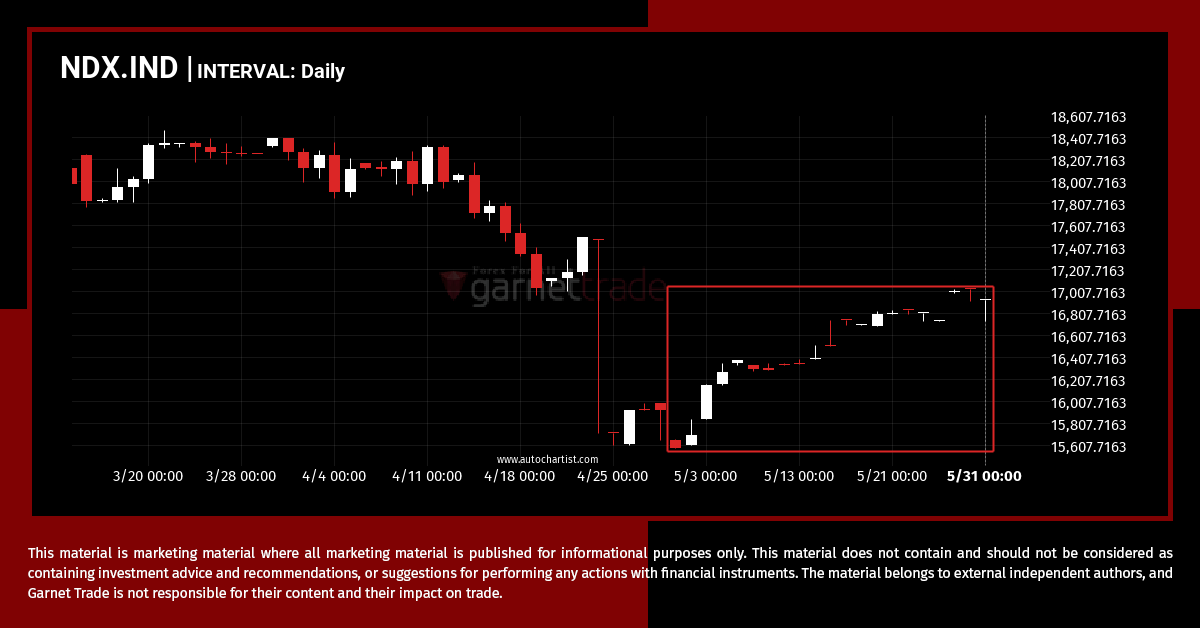
NDX.IND has moved higher by 8.58% from 15581.843 to 16918.9095 in the last 31 days.
USDCAD – Continuation Chart Pattern – Triangle
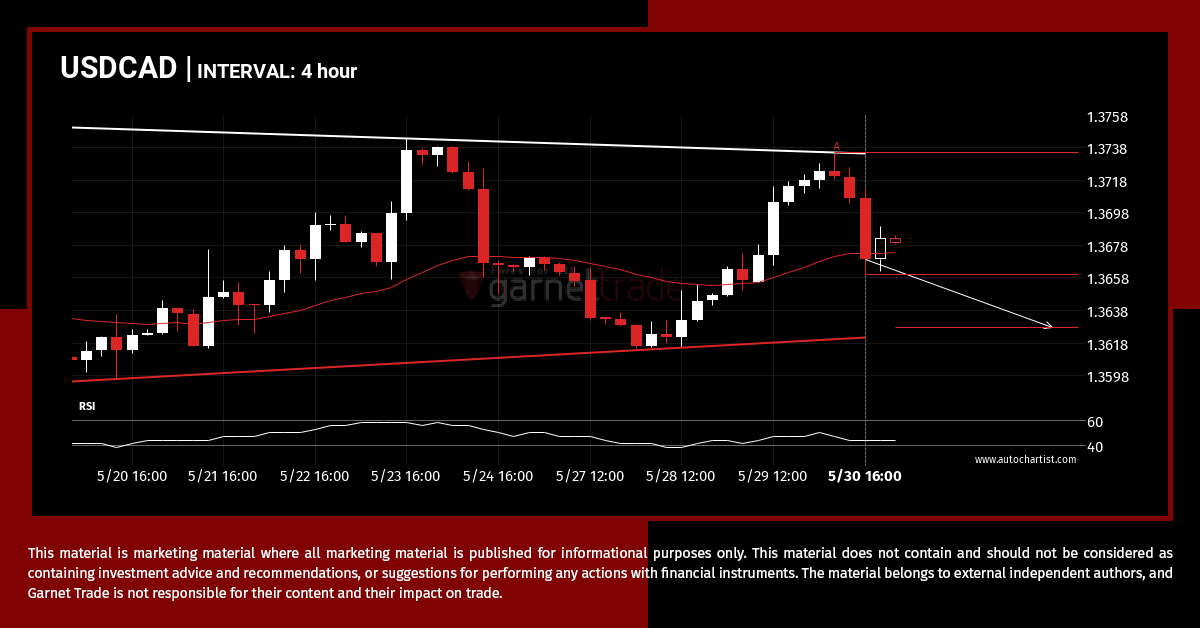
Emerging Triangle pattern in its final wave was identified on the USDCAD 4 hour chart. After a strong bearish run, we find USDCAD heading towards the upper triangle line with a possible resistance at 1.3628. If the support shows to hold, the Triangle pattern suggests a rebound back towards current levels.
XAUUSD approaches important level of 2345.2100
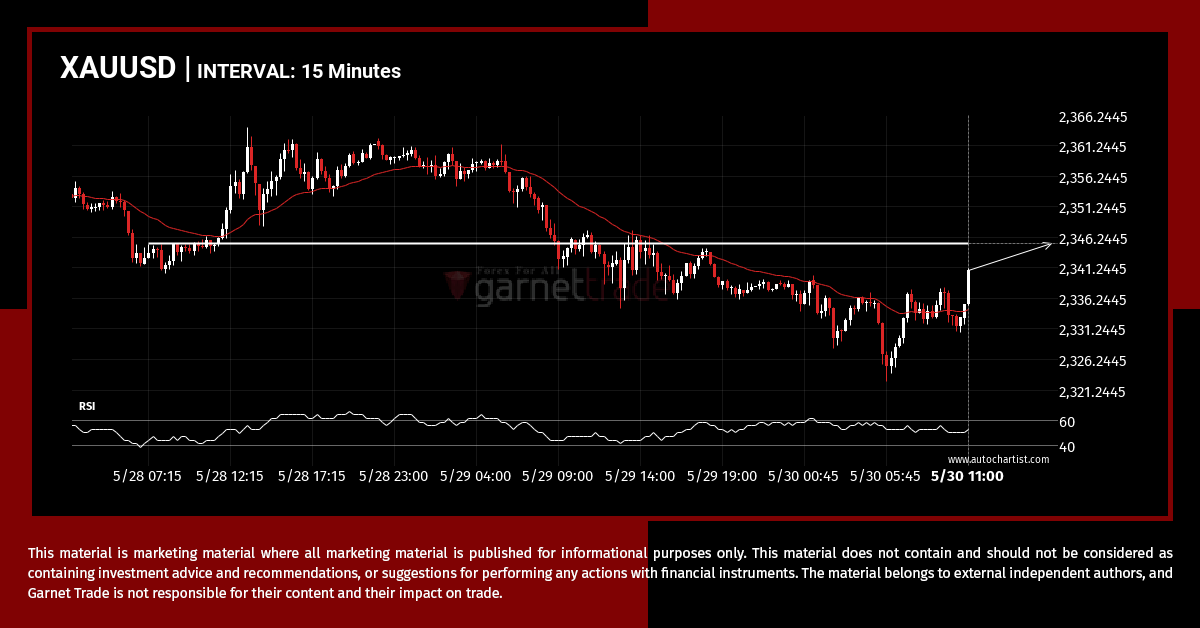
The price of XAUUSD in heading back to the resistance area. It is possible that it will struggle to break through it and move back in the other direction. The price may eventually break through, but typically the price retreats from the level a number of times before doing so.
UKX.IND running downward for the last 2 days
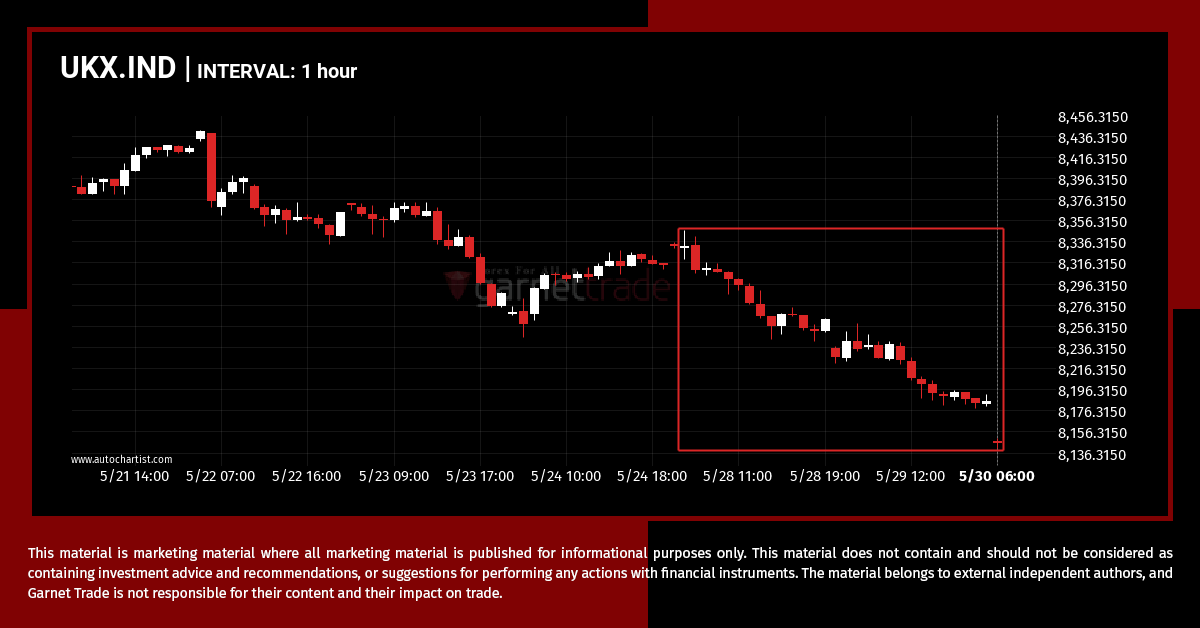
A movement of 2.25% over 3 days on UKX.IND doesn’t go unnoticed. You may start considering where it’s heading next, a continuation of the current downward trend, or a reversal in the previous direction.
Either a rebound or a breakout imminent on SPX.IND
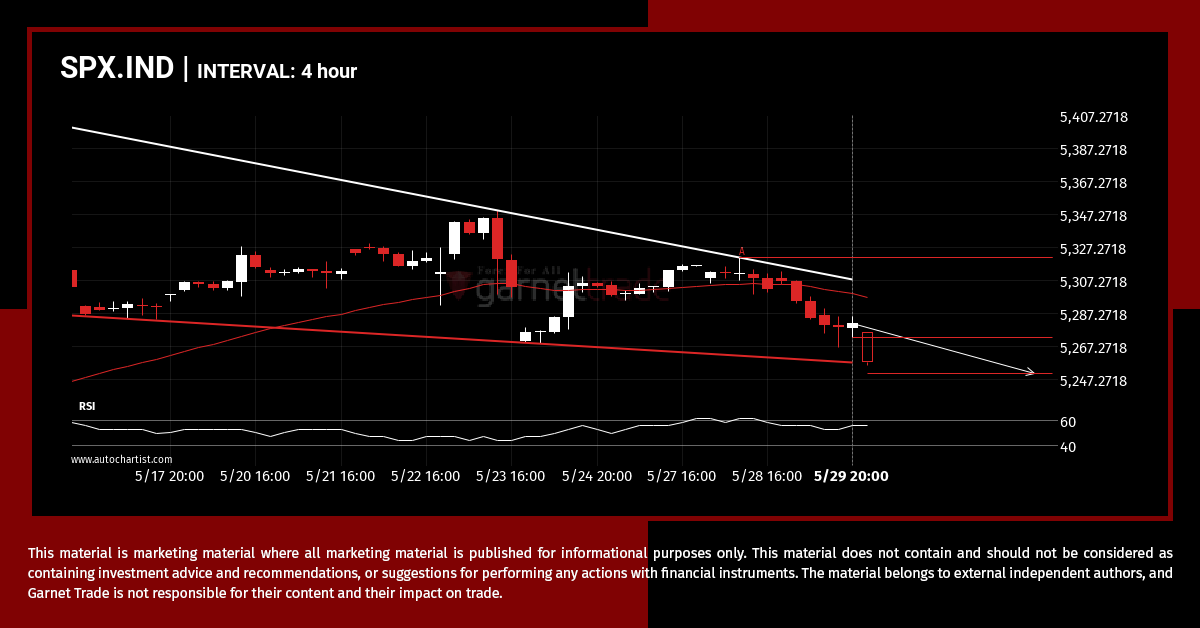
SPX.IND is moving towards a support line which it has tested numerous times in the past. We have seen it retrace from this line before, so at this stage it isn’t clear whether it will breach this line or rebound as it did before. If SPX.IND continues in its current trajectory, we could see it […]

